Prometheus监控学习-安装
序言
学习Prometheus的第一天,这将是一个专栏,博主将根据prometheus官网手册持续更新Prometheus学习笔记。
一、Prometheus介绍
官网介绍:https://prometheus.io/docs/introduction/overview/https://prometheus.io/docs/introduction/overview/
Prometheus是一个开源的监控系统和告警工具包,使用时序数据库保存监控指标,拥有强大的PromQL查询语言,支持多种图表和仪表盘模式。
组件介绍:
先看一下架构图(来自官网的架构图):
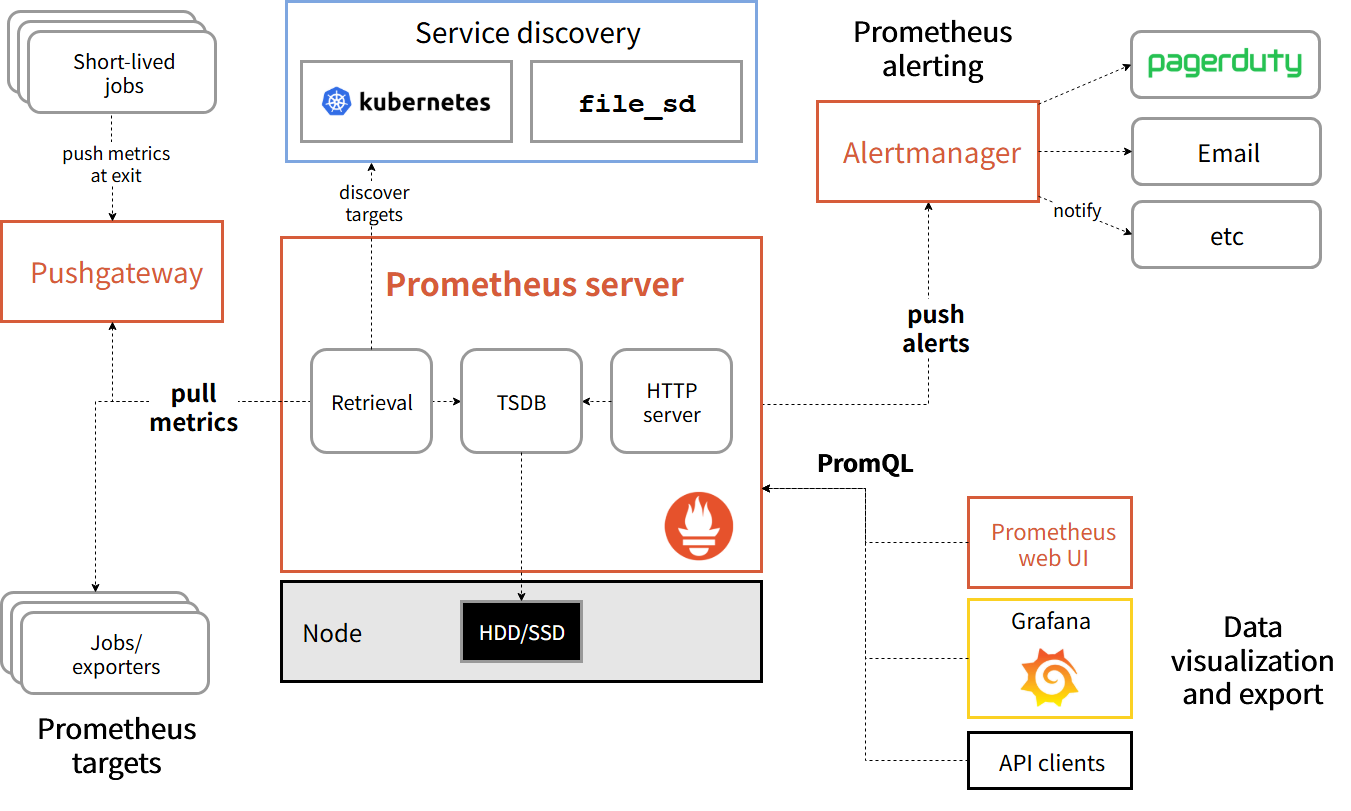
普罗米修斯生态系统由多个组件组成,其中许多是可选的:
- 主要的 普罗米修斯服务器 ,用于抓取和存储时间序列数据
- 用于为应用程序代码添加监控功能的 客户端库
- 一个 推送网关 ,用于支持短期运行的任务
- 为 HAProxy、StatsD、Graphite 等服务提供的特殊用途 exporters
- 一个 alertmanager 用于处理告警
- 各种支持工具
大多数 Prometheus 组件是用 Go 编写的,这使得它们可以轻松地作为静态二进制文件进行构建和部署。
二、Prometheus安装
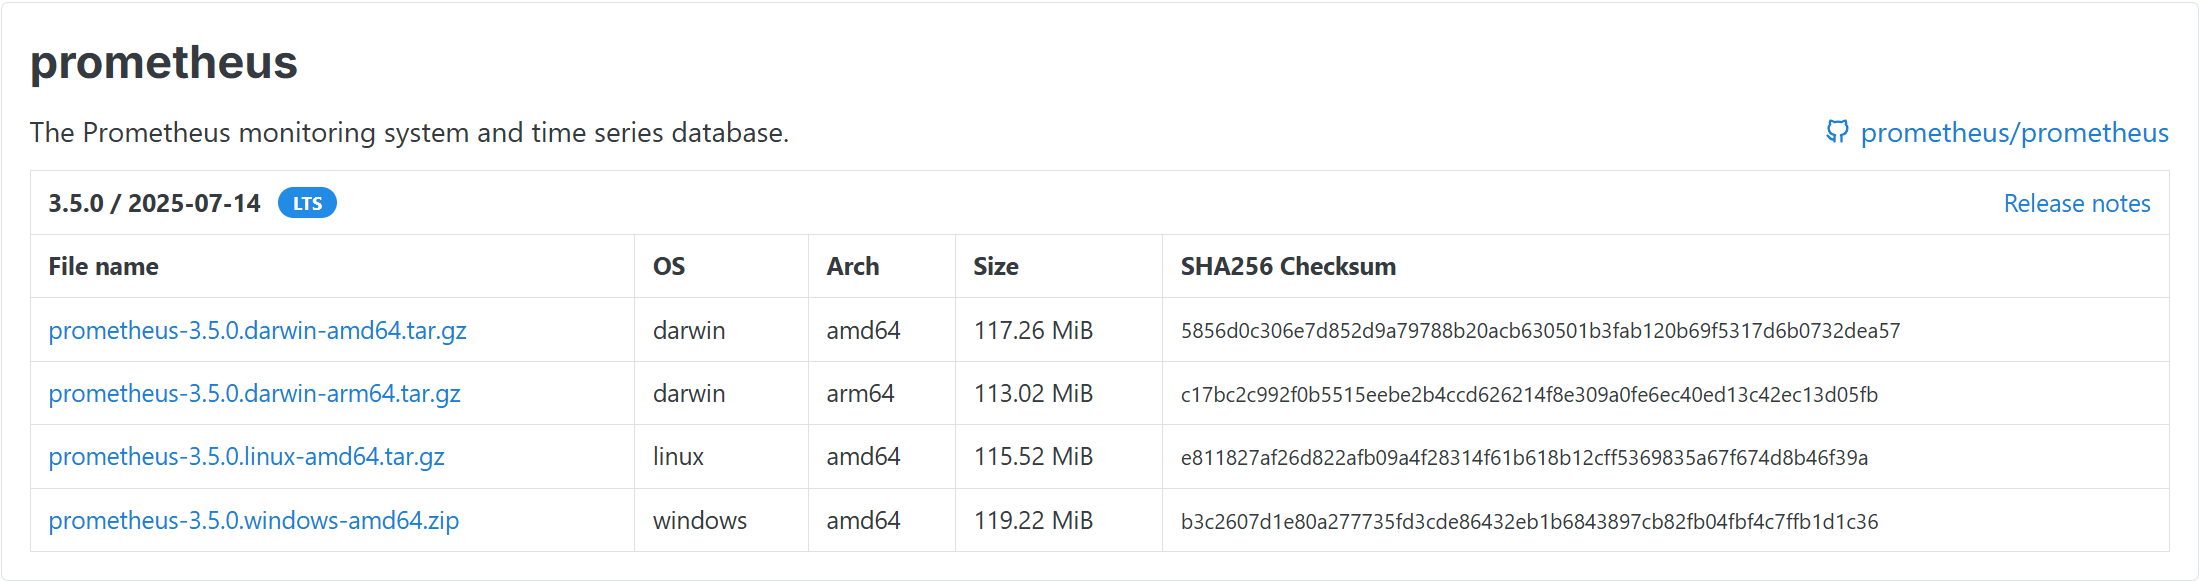
在https://prometheus.io/download/下载页面选择最新的版本进行下载,当前的最新版本为:prometheus-3.5.0.linux-amd64.tar.gz
1. 下载完解压
tar -zxvf prometheus-3.5.0.linux-amd64.tar.gz
cd prometheus-3.5.0.linux-amd64/
./prometheus --help
usage: prometheus [<flags>]The Prometheus monitoring serverFlags:-h, --[no-]help Show context-sensitive help (also try --help-long and --help-man).--[no-]version Show application version.--config.file="prometheus.yml"在启动prometheus前需要配置prometheus
2. 配置prometheus
先来看看当前目录下有哪些文件,都是干嘛的:
root@localhost:/opt/prometheus-3.5.0.linux-amd64# ls -1
LICENSE			# 许可证书
NOTICE			# 第三方依赖库版权声明,列明引用的其它开源项目。
prometheus		#主程序二进制,启动后就是 Prometheus Server,负责抓取、存储、查询指标。
prometheus.yml	#核心配置文件(YAML 格式),定义:
promtool		#promtool 是 Prometheus 官方自带的“瑞士军刀”命令行工具,用来检查配置、调试查询、备份/恢复数据以及做日常运维诊断。
配置文件参数含义解释:
配置模块含义总览:
| 配置块 | 作用 | 常见字段示例 |
|---|---|---|
| global | 全局默认值 | scrape_interval: 15s(多久抓一次) evaluation_interval: 15s(多久算一次告警规则) |
| alerting | 告警发送给谁 | alertmanagers: - targets: [‘localhost:9093’] |
| rule_files | 告警/记录规则文件列表 | - “first_rules.yml” - “second_rules.yml” |
| scrape_configs | 真正要监控的目标 | job_name、targets、metrics_path、scheme 等 |
# 全局配置
global:	scrape_interval: 15s		# 将数据采集间隔设置为每 15 秒一次。默认设置为每 1 分钟一次。evaluation_interval: 15s  # 每 15 秒评估一次规则。默认设置为每 1 分钟评估一次。scrape_timeout: 10s		# 采集超时时间默认是10s# 告警配置
alerting:alertmanagers:- static_configs:- targets:# - alertmanager:9093  # 指定 Alertmanager 的地址列表,目前暂未启用# 一次性加载规则,并按照全局的“评估间隔(evaluation_interval)”定期对其进行评估。
rule_files:# - "first_rules.yml"			#暂未启用# - "second_rules.yml"		#暂未启用# 一个包含一个待抓取端点的抓取配置:
# 目前配置的是Prometheus本身
scrape_configs:# 任务名称,会作为标签 job=prometheus 写进每条指标- job_name: "prometheus"# 指定Prometheus抓取指标时的后缀(默认/metrics)metrics_path: "/metrics"# 指定协议是http还是https(默认http)scheme: "http"#静态目标列表,适合少量固定地址,如下是prometheus本身static_configs:		- targets: ["localhost:9090"]# # 额外静态标签,所有来自该 job 的指标都会带上 app="prometheus"labels:		app: "prometheus"
3. 启动prometheus
在启动prometheus可以先使用promtool 工具来检查一下配置文件是否有效。
./promtool check config prometheus.yml
Checking prometheus.ymlSUCCESS: prometheus.yml is valid prometheus config file syntax
启动prometheus
./prometheus --config.file=prometheus.yml
通过 http://localhost:9090 浏览到关于自身的状态页面。给它大约 30 秒的时间,从它自己的 HTTP 指标端点收集数据。
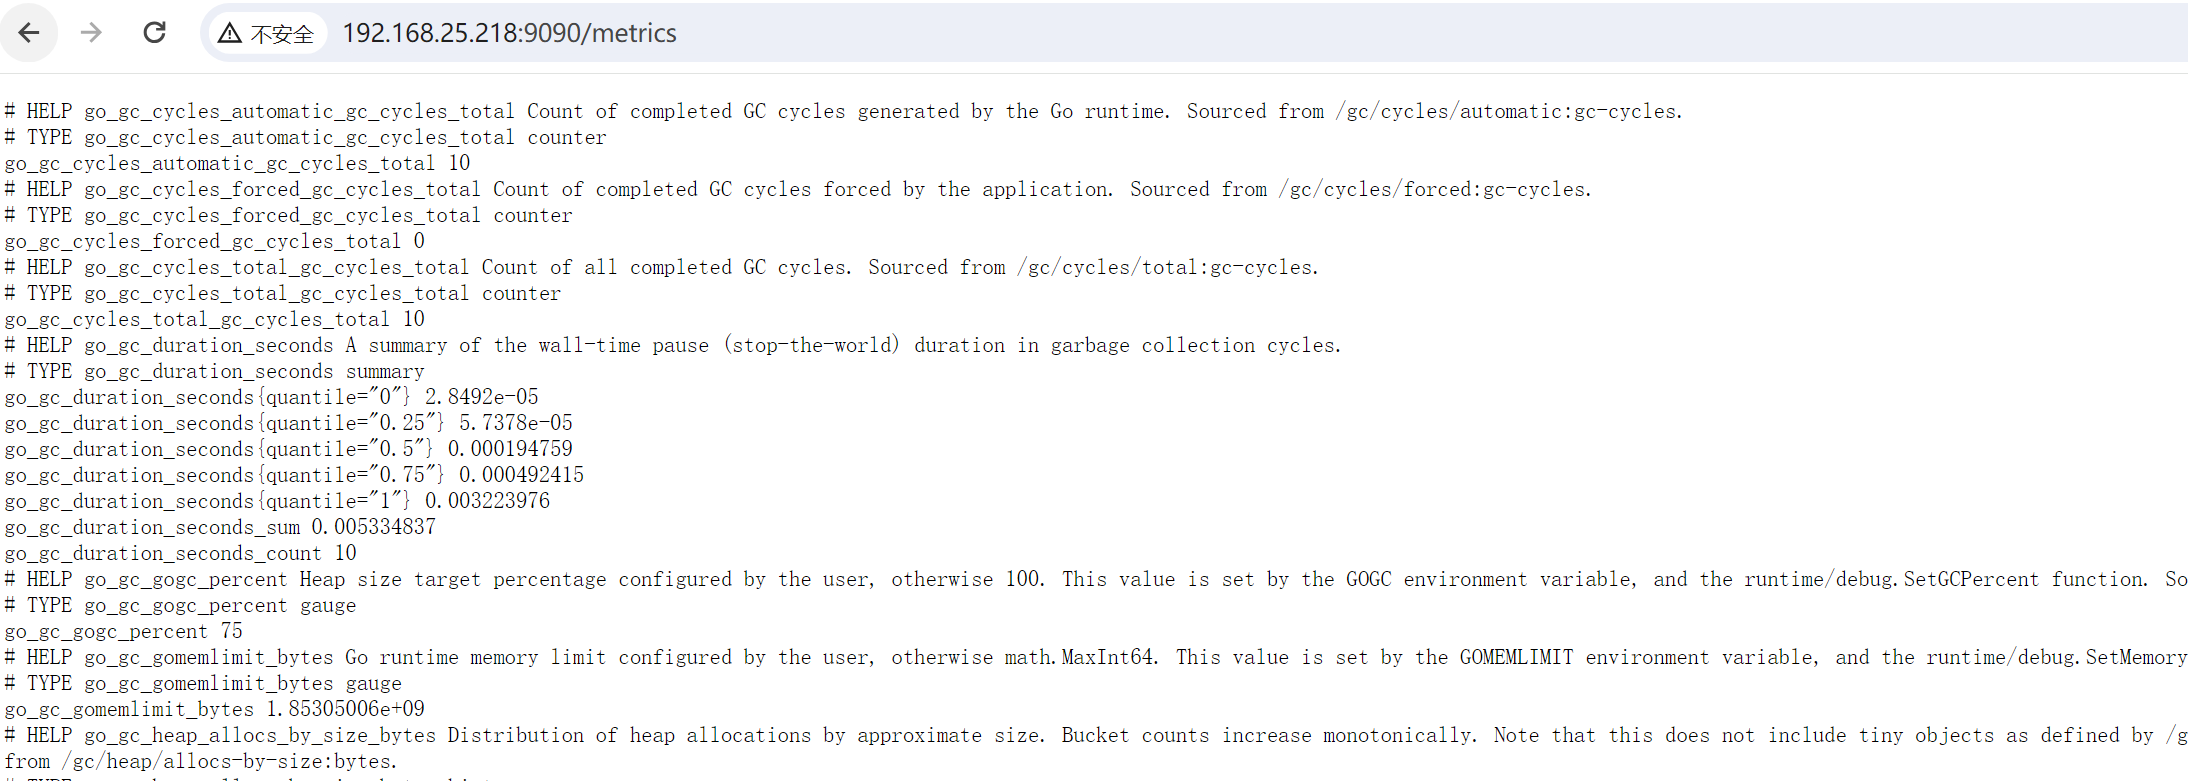
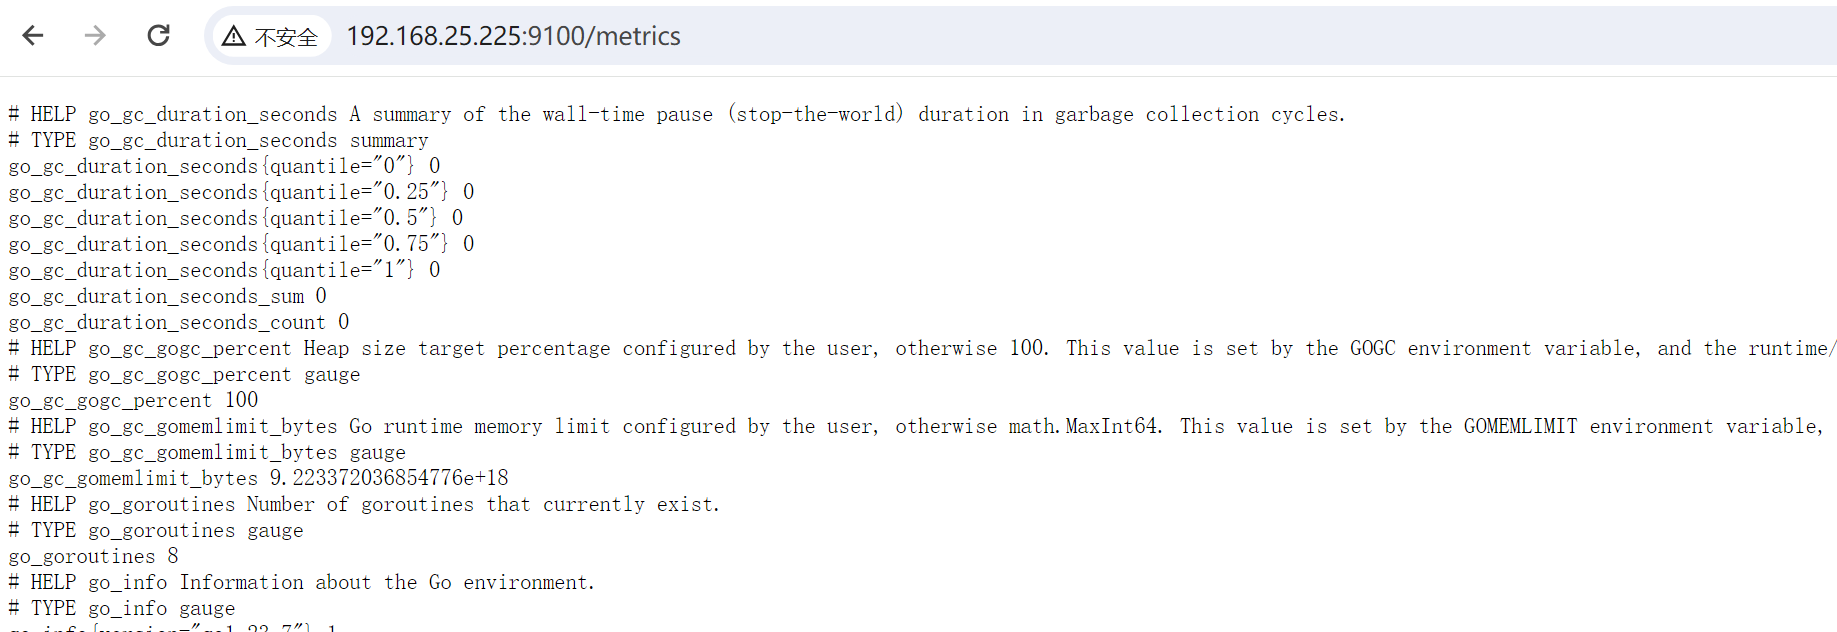
可以通过http://localhost:9090/metrics 查看自己的监控指标,在上面配置文件中有说明。
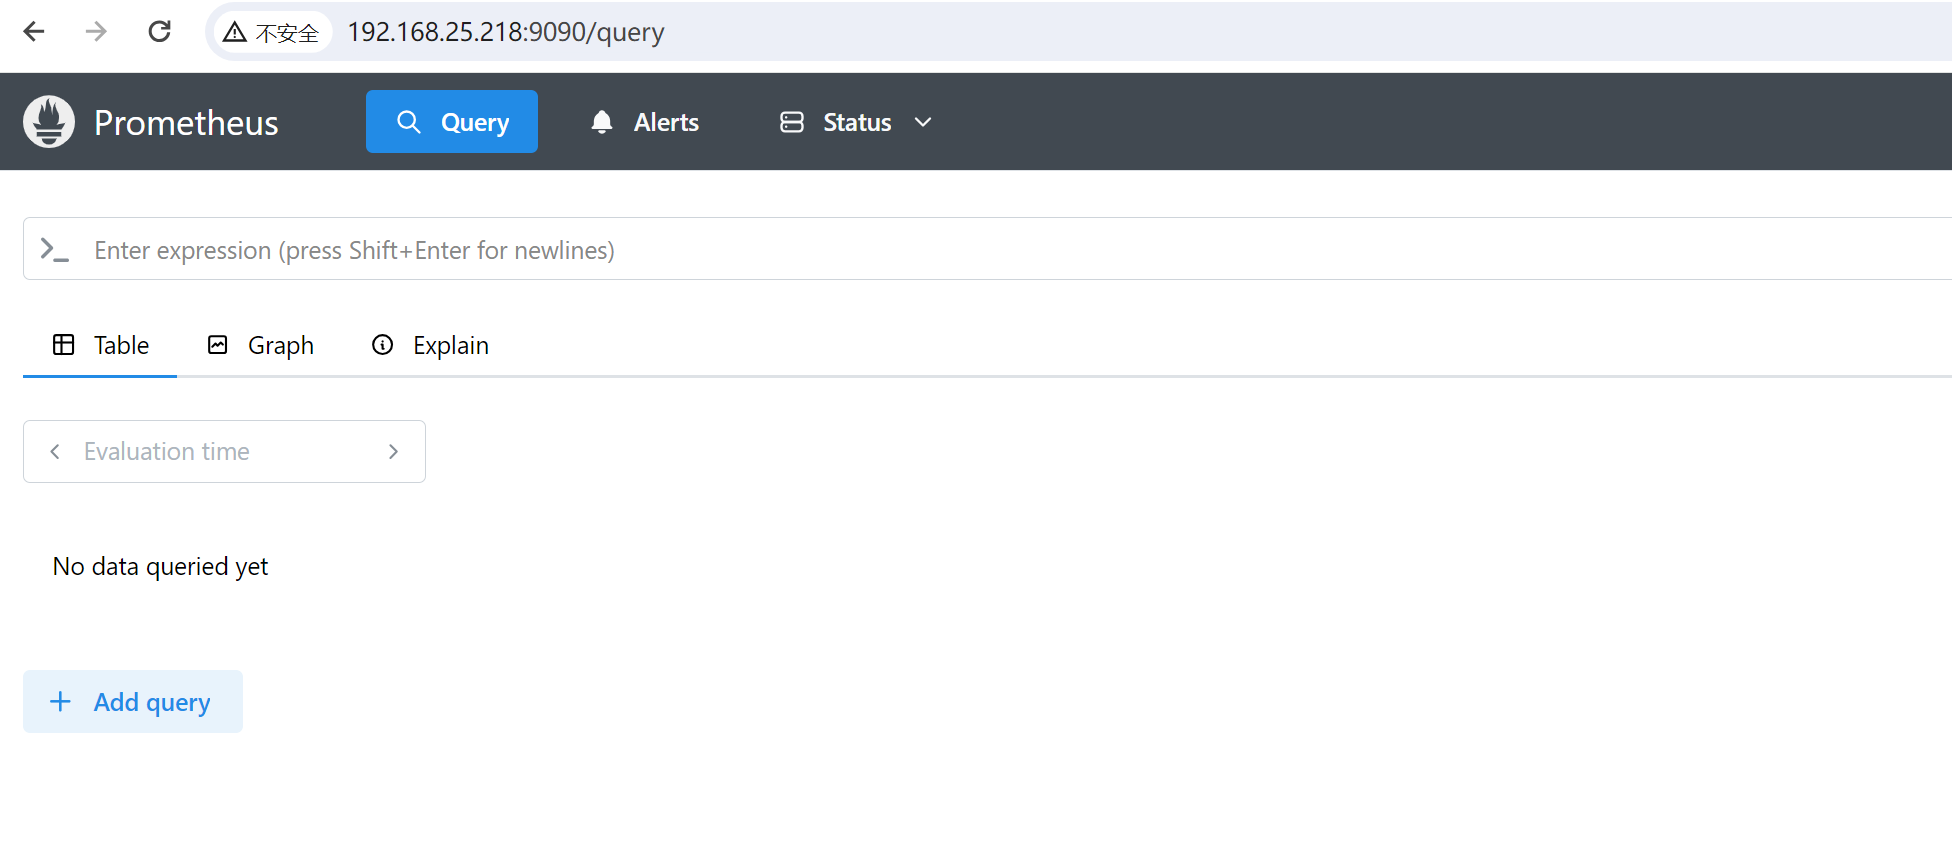
4. 在浏览器中使用表达式查询数据
promhttp_metric_handler_requests_total 指标可以查询查看Prometheus 服务器处理的 /metrics 请求总数:
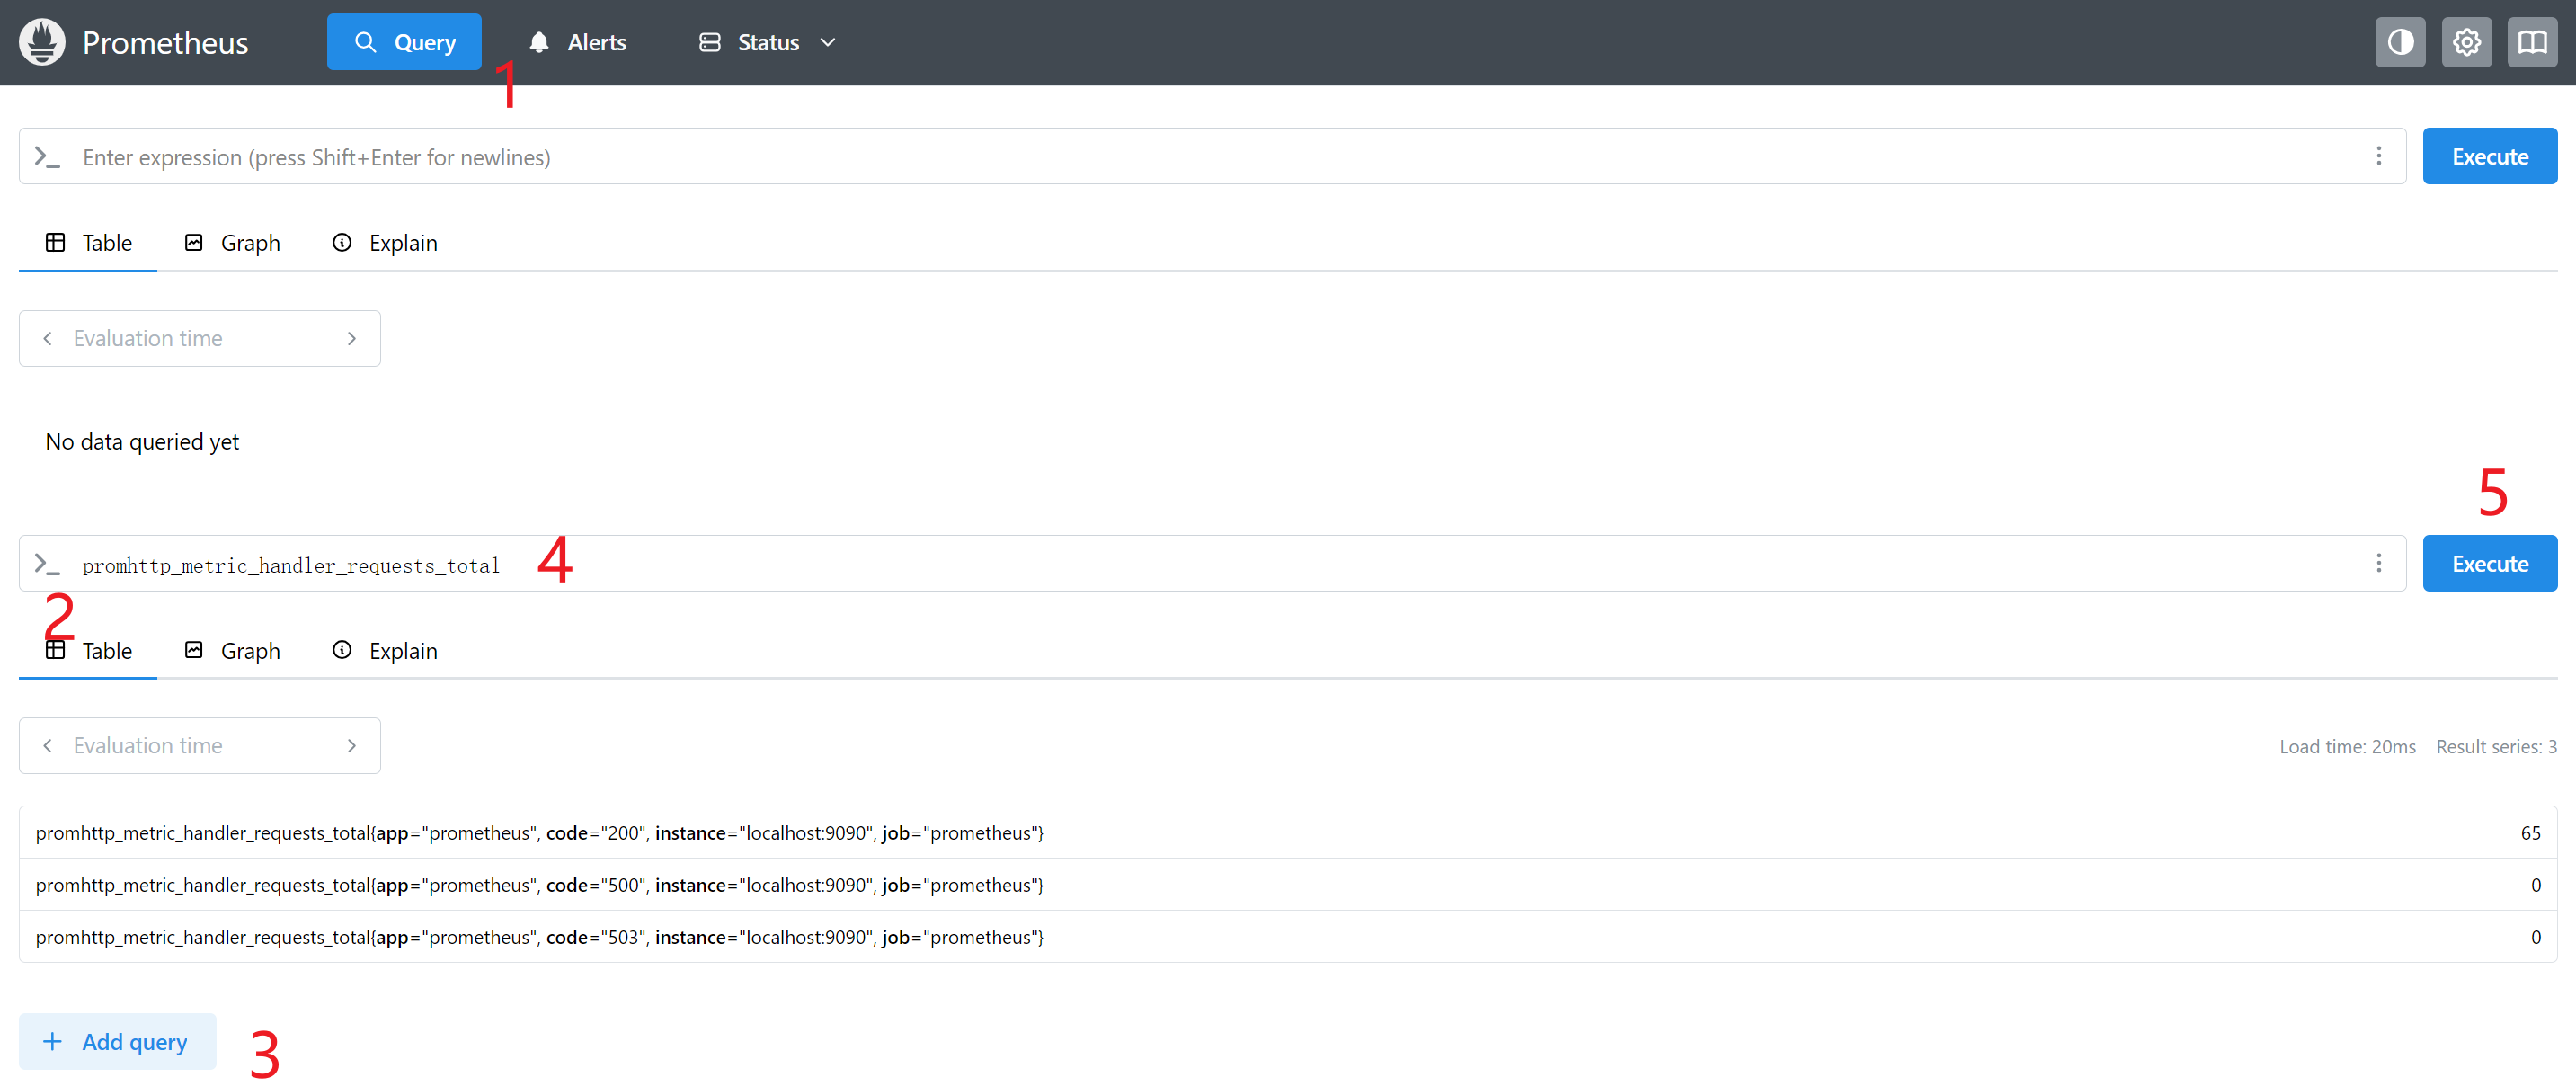
表达式语言的更多信息,阅读: https://prometheus.io/docs/querying/basics/
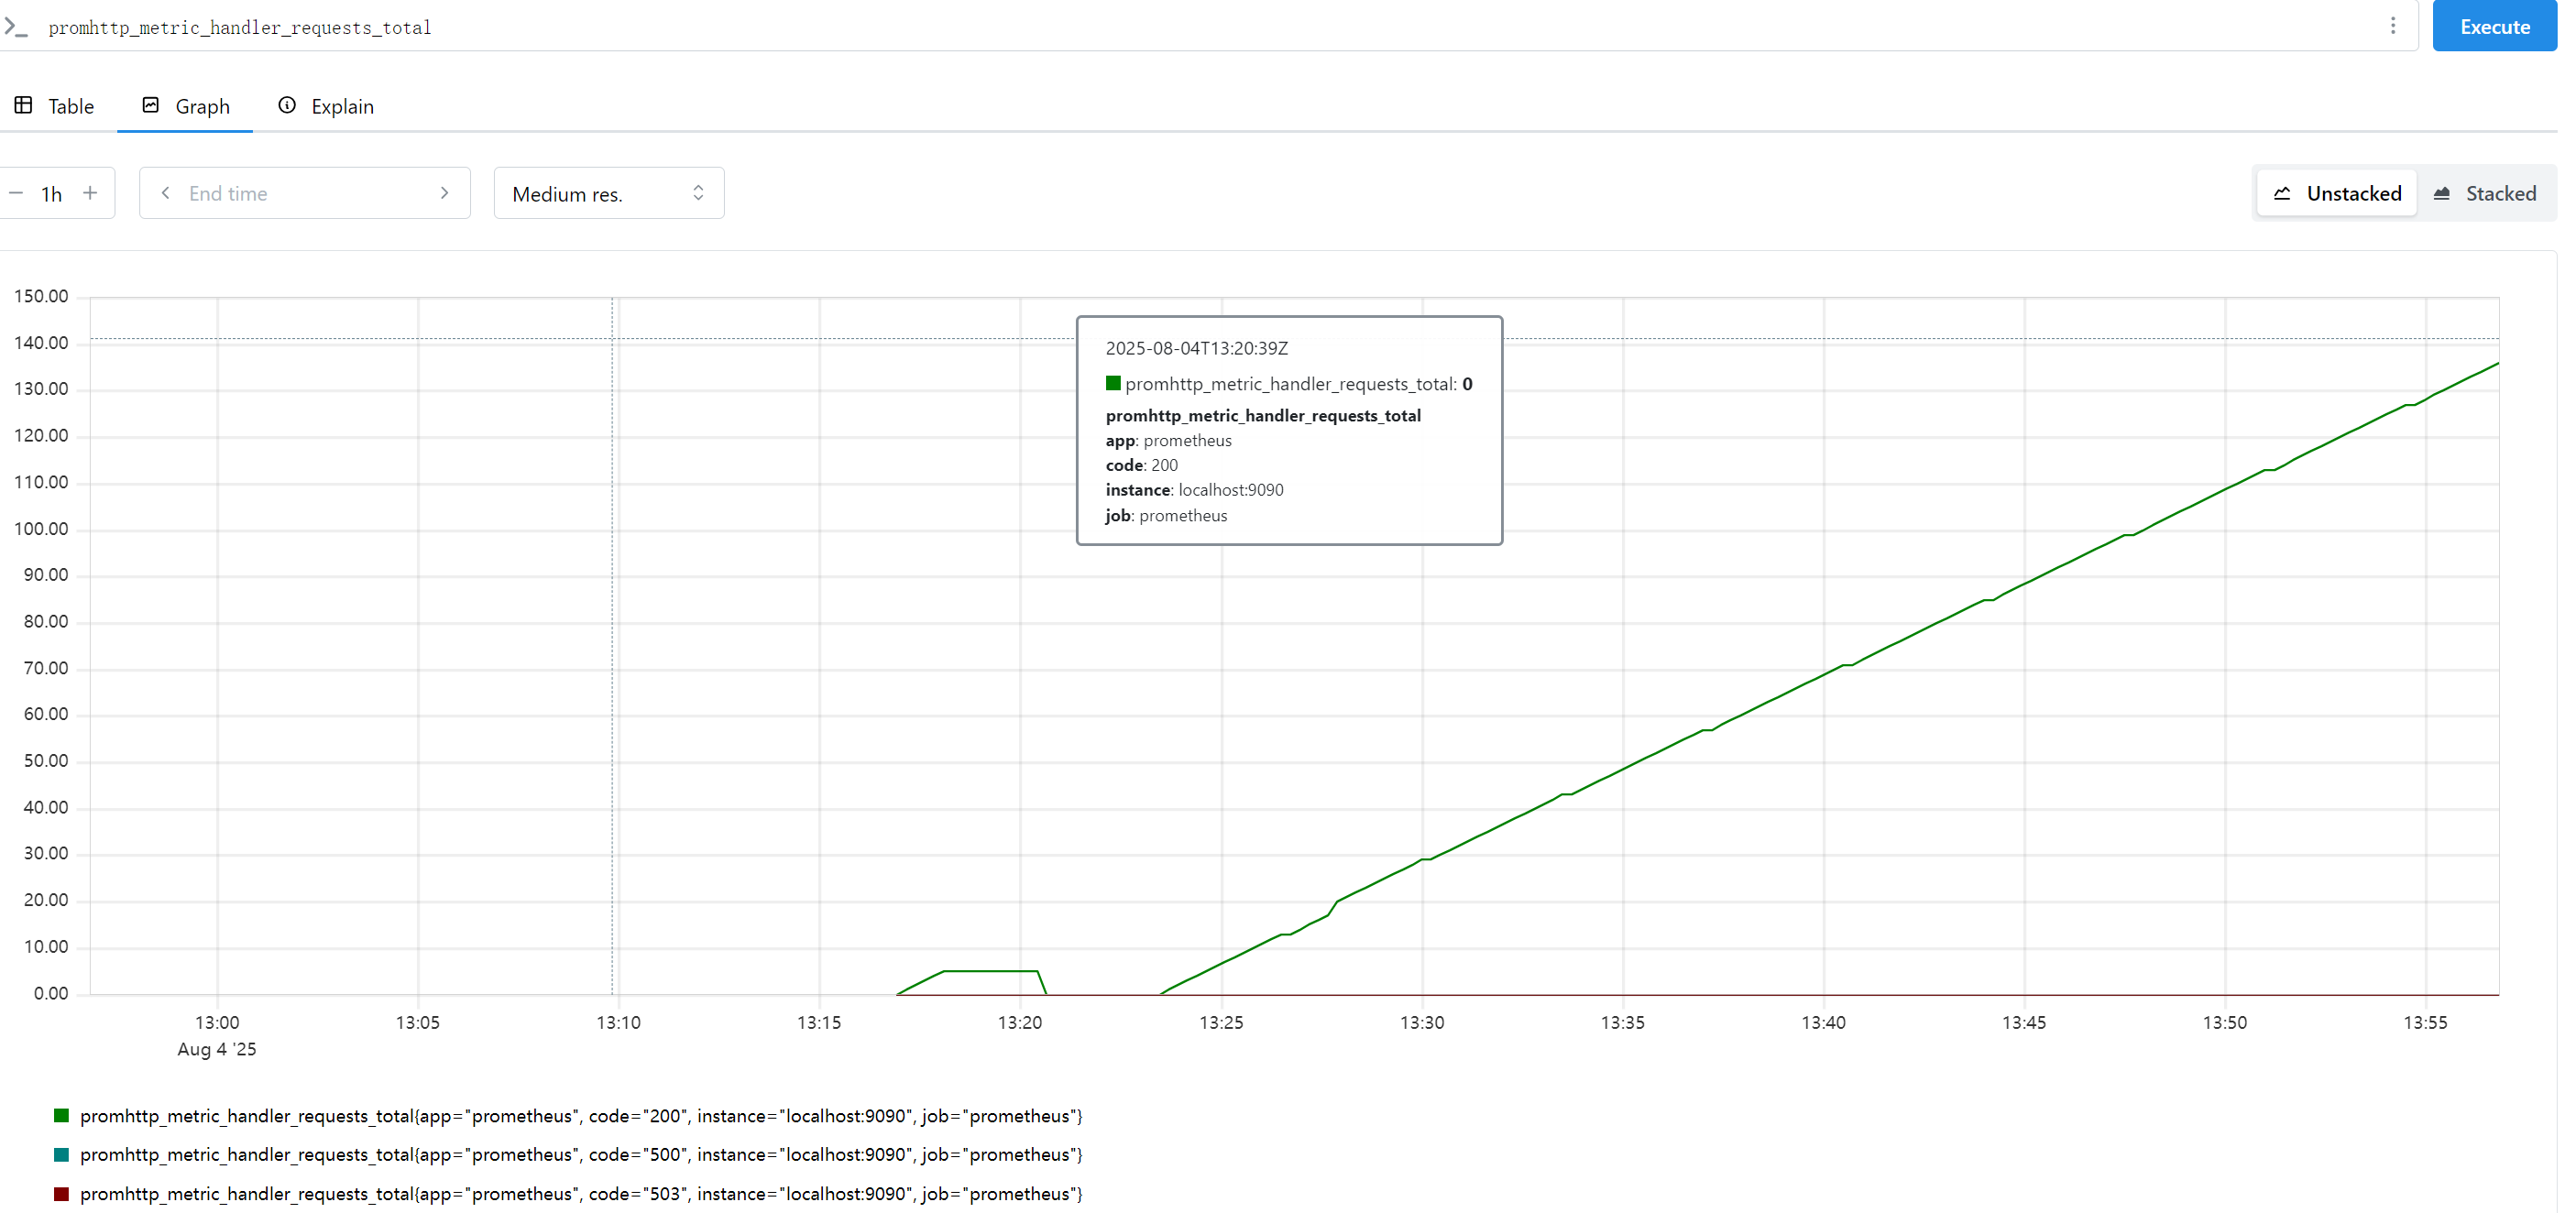
点击Graph查看图标信息:
5. Status字段中所字段功能讲解
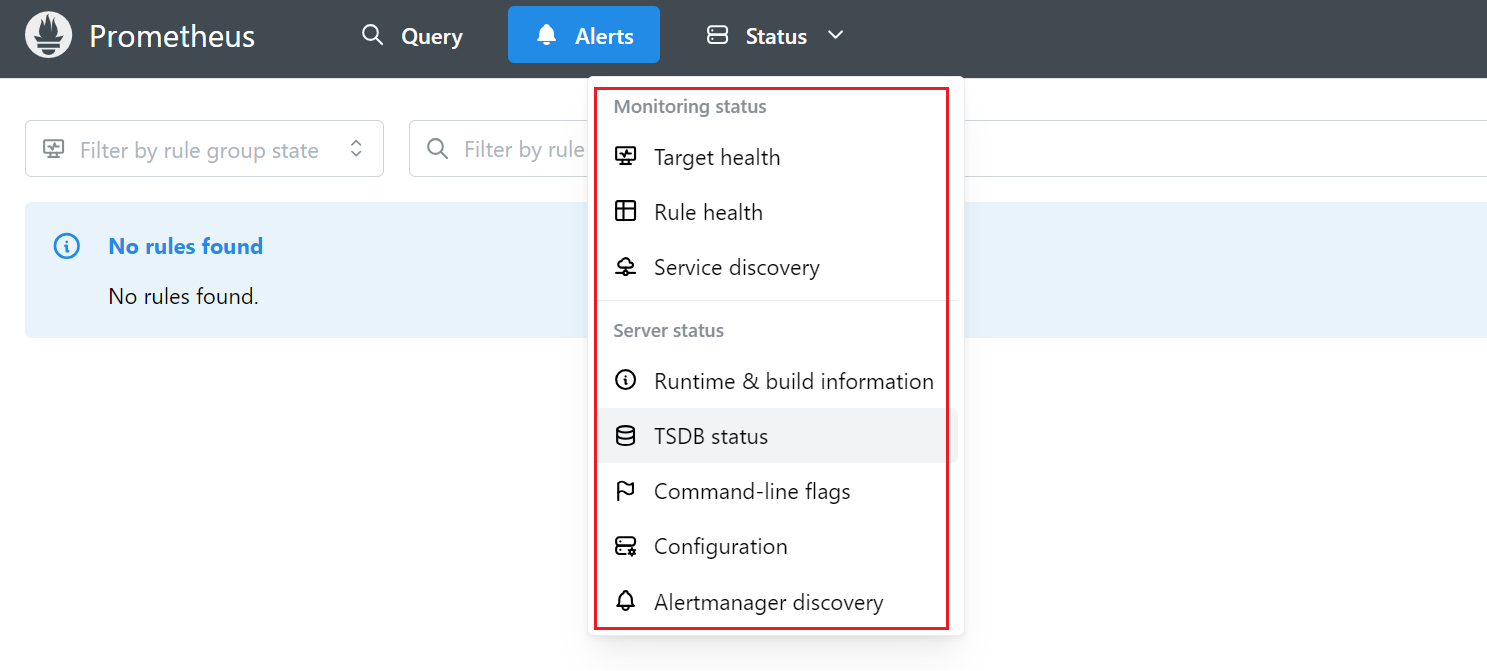
Monitoring status:
监控状态页:显示 规则组 和 目标健康度 的汇总
| 图标/文字 | 功能名称 | 作用说明 |
|---|---|---|
| Target health | 目标健康 | 列出所有 抓取目标 的 UP/DOWN 状态 |
| Rule health | 规则健康 | 检查 告警/记录规则 是否加载成功 |
| Service discovery | 服务发现 | 查看 Prometheus 通过 文件、Consul、K8s 等 动态发现的目标 |
Server status:
服务器状态:
| 图标/文字 | 功能名称 | 作用说明 |
|---|---|---|
| Runtime & build information | 运行环境 | 显示 版本、编译时间、启动参数、Go 版本 等 |
| TSDB status | TSDB 状态 | 查看 存储块、标签数、磁盘大小、保留时间 |
| Command-line flags | Command-line flags | 列出 启动 Prometheus 时传的所有 flag |
| Configuration | 当前配置 | 在线查看 prometheus.yml 的完整内容(非编辑) |
| Alertmanager discovery | Alertmanager 发现 | 展示 Prometheus 发现到的 Alertmanager 实例 列表 |
三、监控其他主机
因为prometheus采用的是时序数据库,所有需要确保,prometheus 和 node的时间保持一致,这很重要!
其实prometheus在配置文件中已经把自己监控进去了:
static_configs:- targets: ["localhost:9090"]
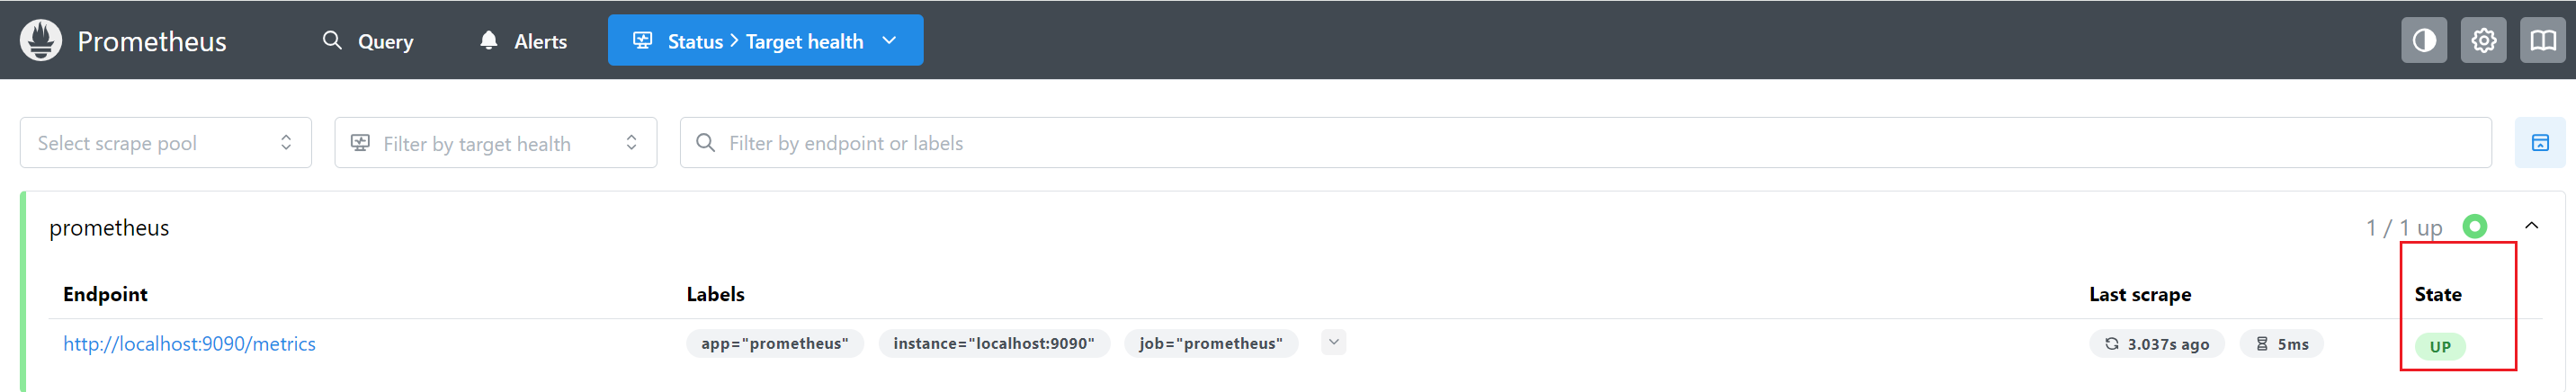
可以在Status–>Target health 查看监控主机的状态
准备两台被监控主机:
| 主机名 | ip |
|---|---|
| node01 | 192.168.25.227 |
| node02 | 192.168.25.228 |
| prometheus | 192.168.25.225 |
使用 Node Exporter 监控 Linux 主机指标:文档参考:https://prometheus.io/docs/guides/node-exporter/
要监控windows使用Windows exporter:https://github.com/prometheus-community/windows_exporter
在每台主机上下载:node_exporter
wget https://github.com/prometheus/node_exporter/releases/download/v1.9.1/node_exporter-1.9.1.linux-amd64.tar.gz
tar xvfz node_exporter-*.*-amd64.tar.gz
cd node_exporter-*.*-amd64
./node_exporter
使用http://192.168.25.225:9100/metrics 可以查看监控指标
使用http://192.168.25.227:9100/metrics 可以查看监控指标
使用http://192.168.25.228:9100/metrics 可以查看监控指标
配置 Prometheus 实例
如下:将node和prometheus分开做了两个 job_name,node使用了app:”node“标签。
scrape_configs:- job_name: "prometheus"metrics_path: "/metrics"scheme: "http"static_configs:- targets: ["localhost:9090","localhost:9100"]labels:app: "prometheus"- job_name: "node"static_configs:- targets: ["192.168.25.227:9100","192.168.25.228:9100"]labels:app: "node"
配置完重启。
查看监控状态:
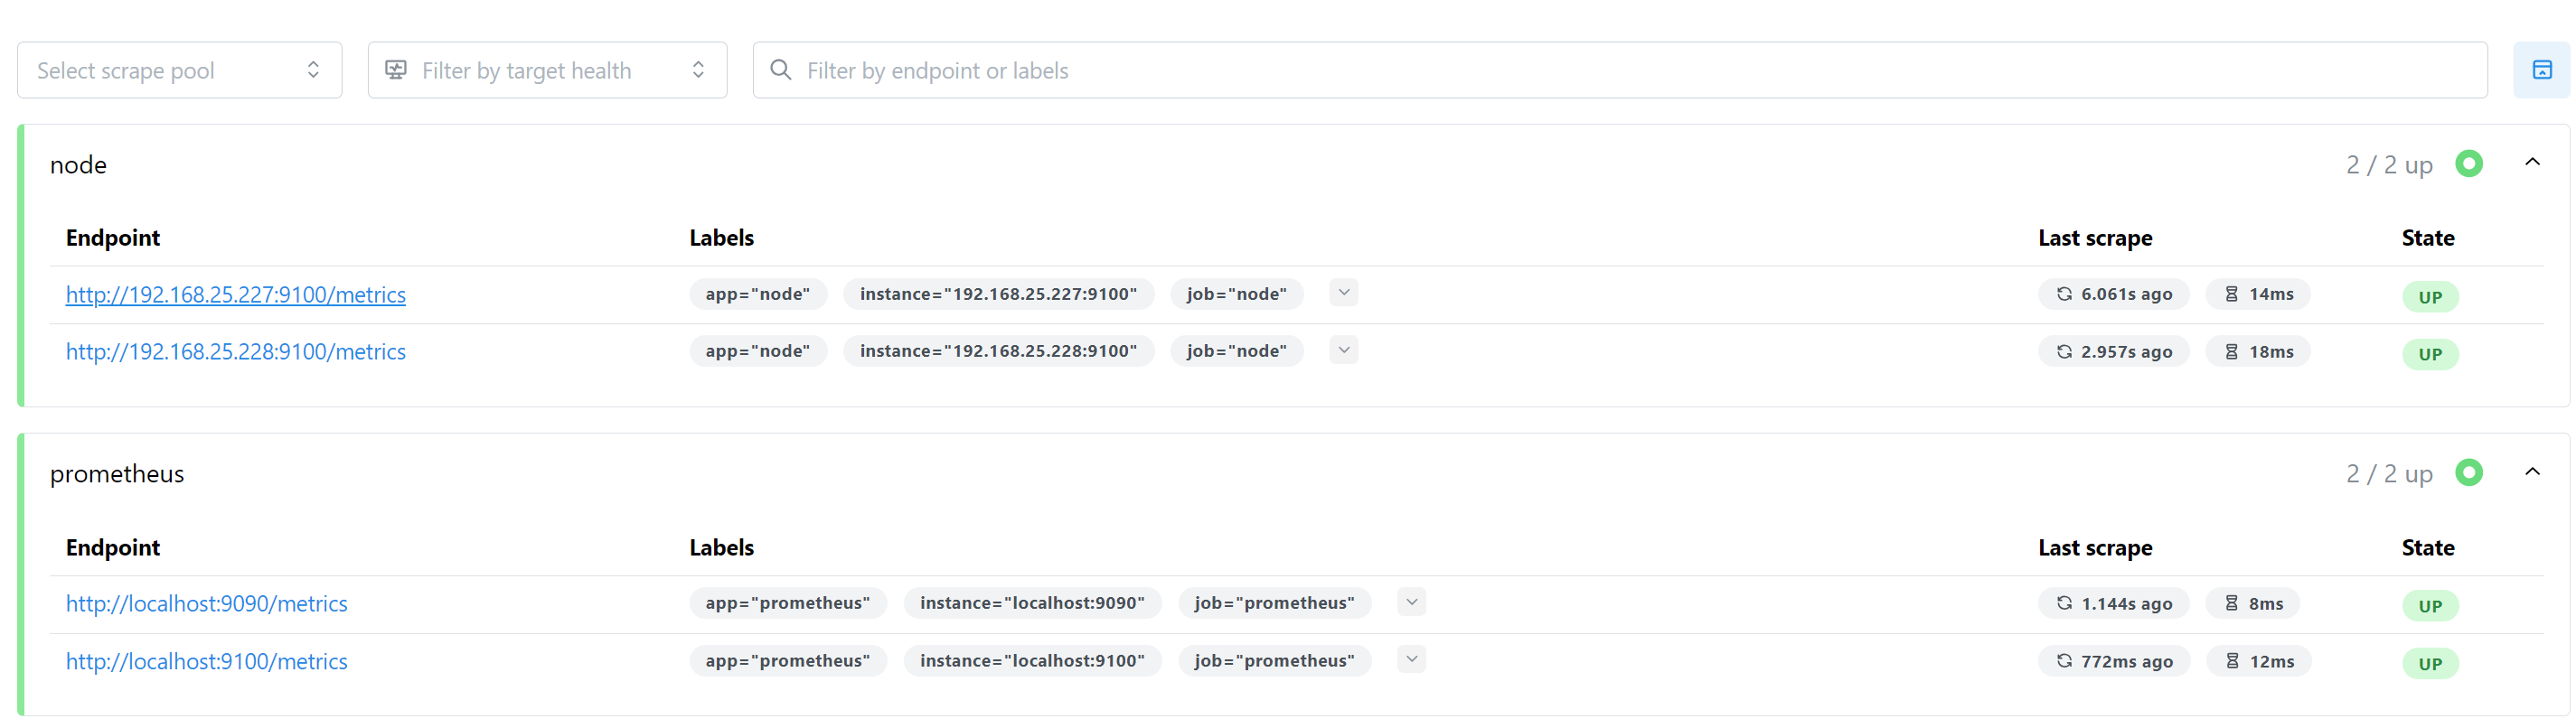
全部UP,已被监控。
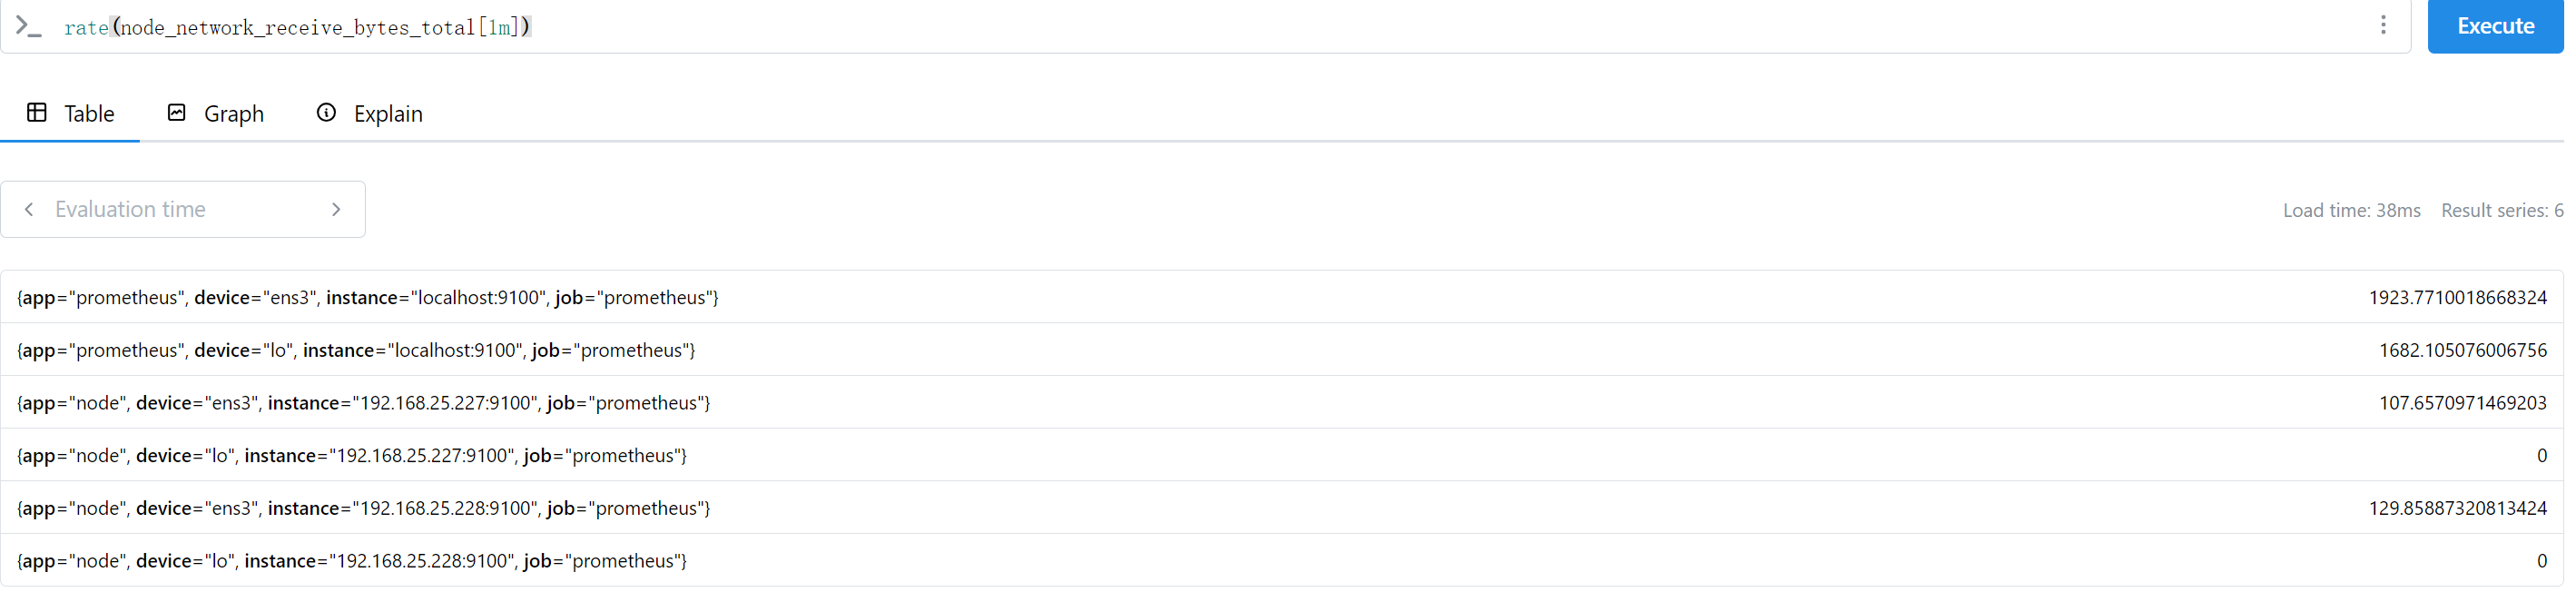
现在可以在192.168.25.225:9090/query使用表达式获取,监控指标的值:
示例:node_filesystem_avail_bytes: 过去一分钟内每秒接收的平均网络流量(以字节为单位)
四、使用 Grafana 可视化指标
Grafana 安装文档:https://grafana.com/docs/grafana/latest/setup-grafana/installation/
我这里使用的系统使用的ubuntu
mkdir -p /etc/apt/keyrings/
wget -q -O - https://apt.grafana.com/gpg.key | gpg --dearmor | sudo tee /etc/apt/keyrings/grafana.gpg > /dev/null
echo "deb [signed-by=/etc/apt/keyrings/grafana.gpg] https://apt.grafana.com stable main" | sudo tee -a /etc/apt/sources.list.d/grafana.list
apt-get update
apt-get install grafana-enterprise -y
systemctl enable grafana-server --now
grafana-server -v
Version 12.1.0 (commit: 1fdeca10151ec766ff2e9e5eaf4c7d05b666dea4, branch: HEAD, enterprise-commit: b5c636eacf65c853df4b0639e2ac6761f8c7e241)
更多安装方式,参考官方文档。
使用3000端口访问,账号密码:admin/admin 第一次登录会要求修改密码。
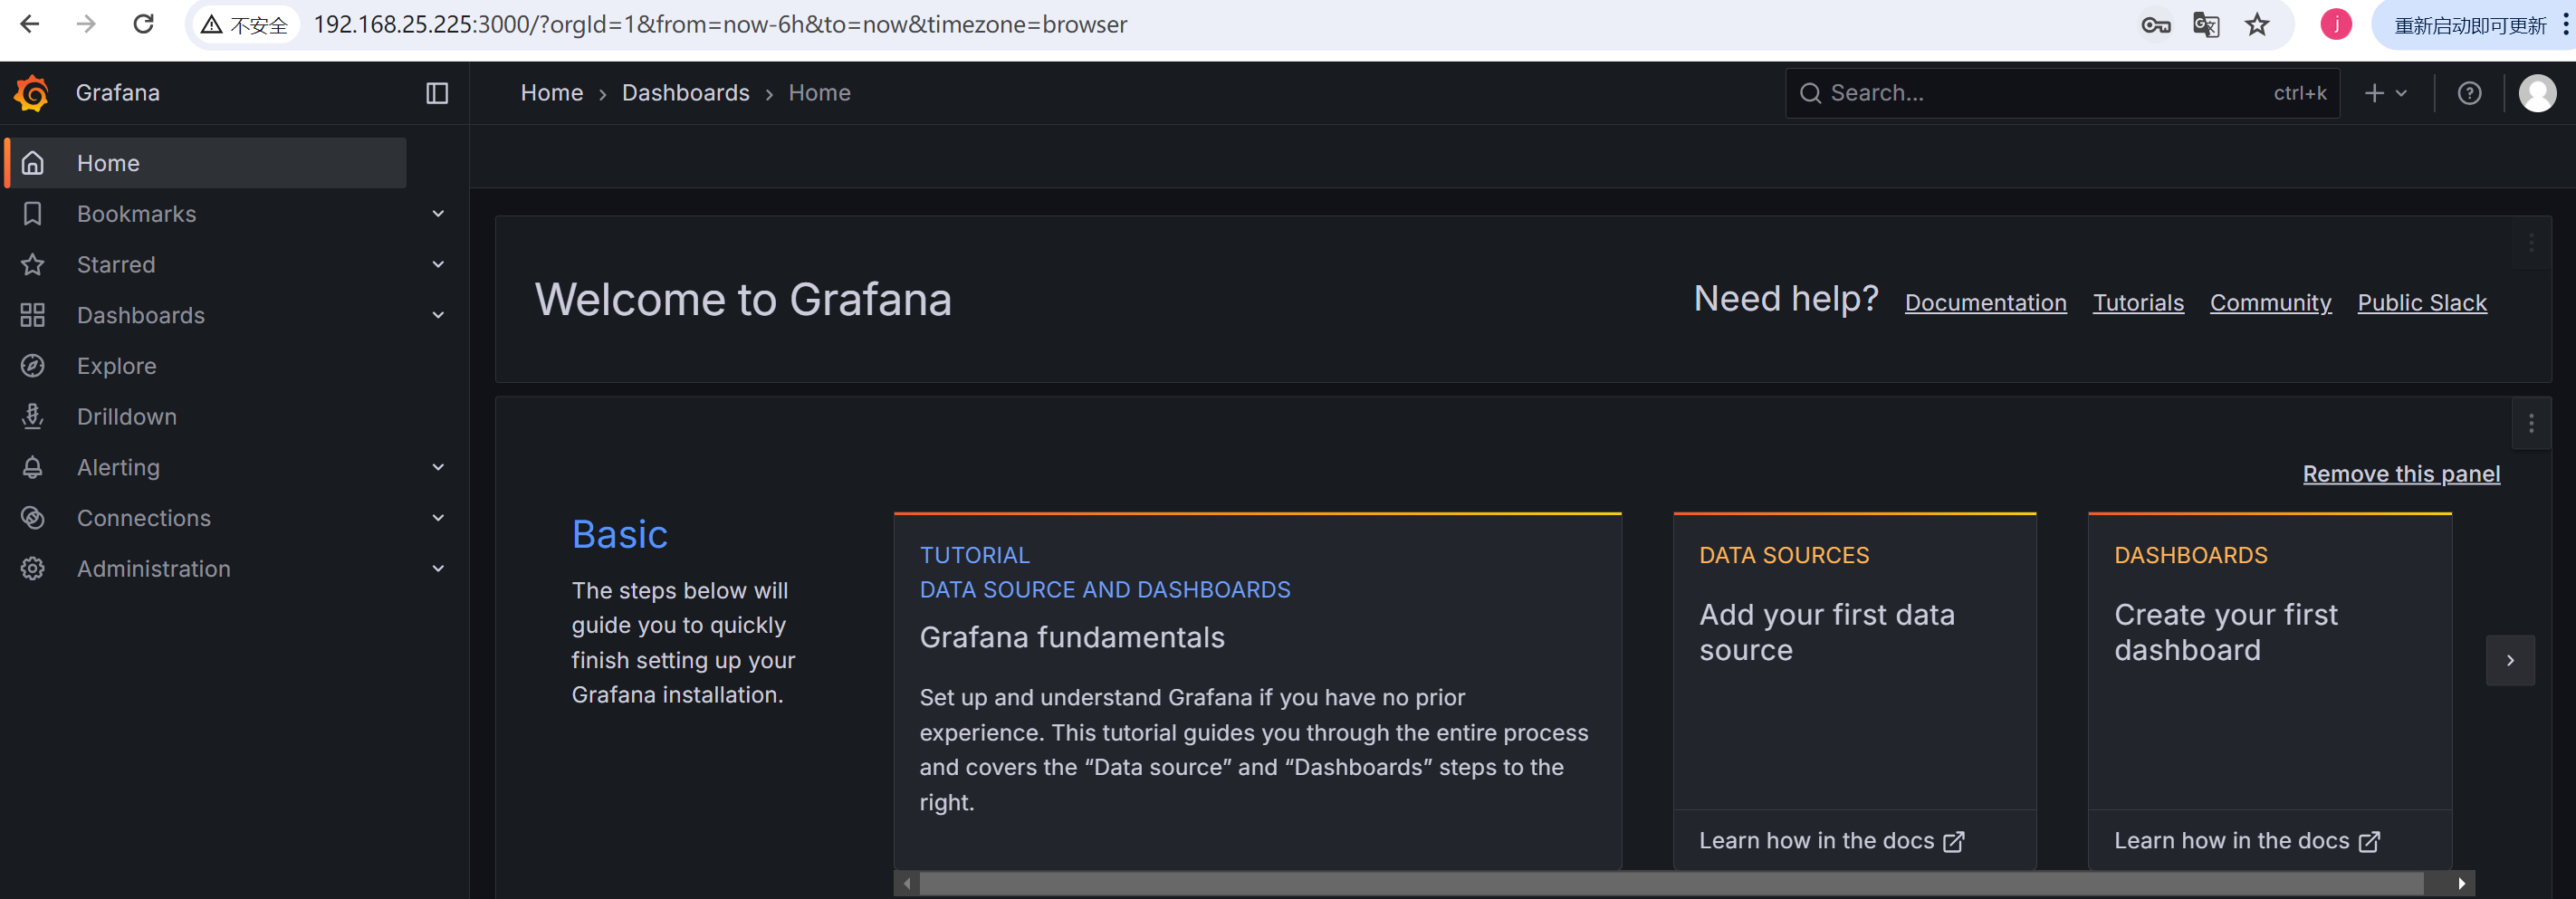
接下来将 Prometheus 作为Grafana 的数据源:
Grafana 有提供操作文档:https://grafana.com/docs/grafana/latest/datasources/prometheus/configure/
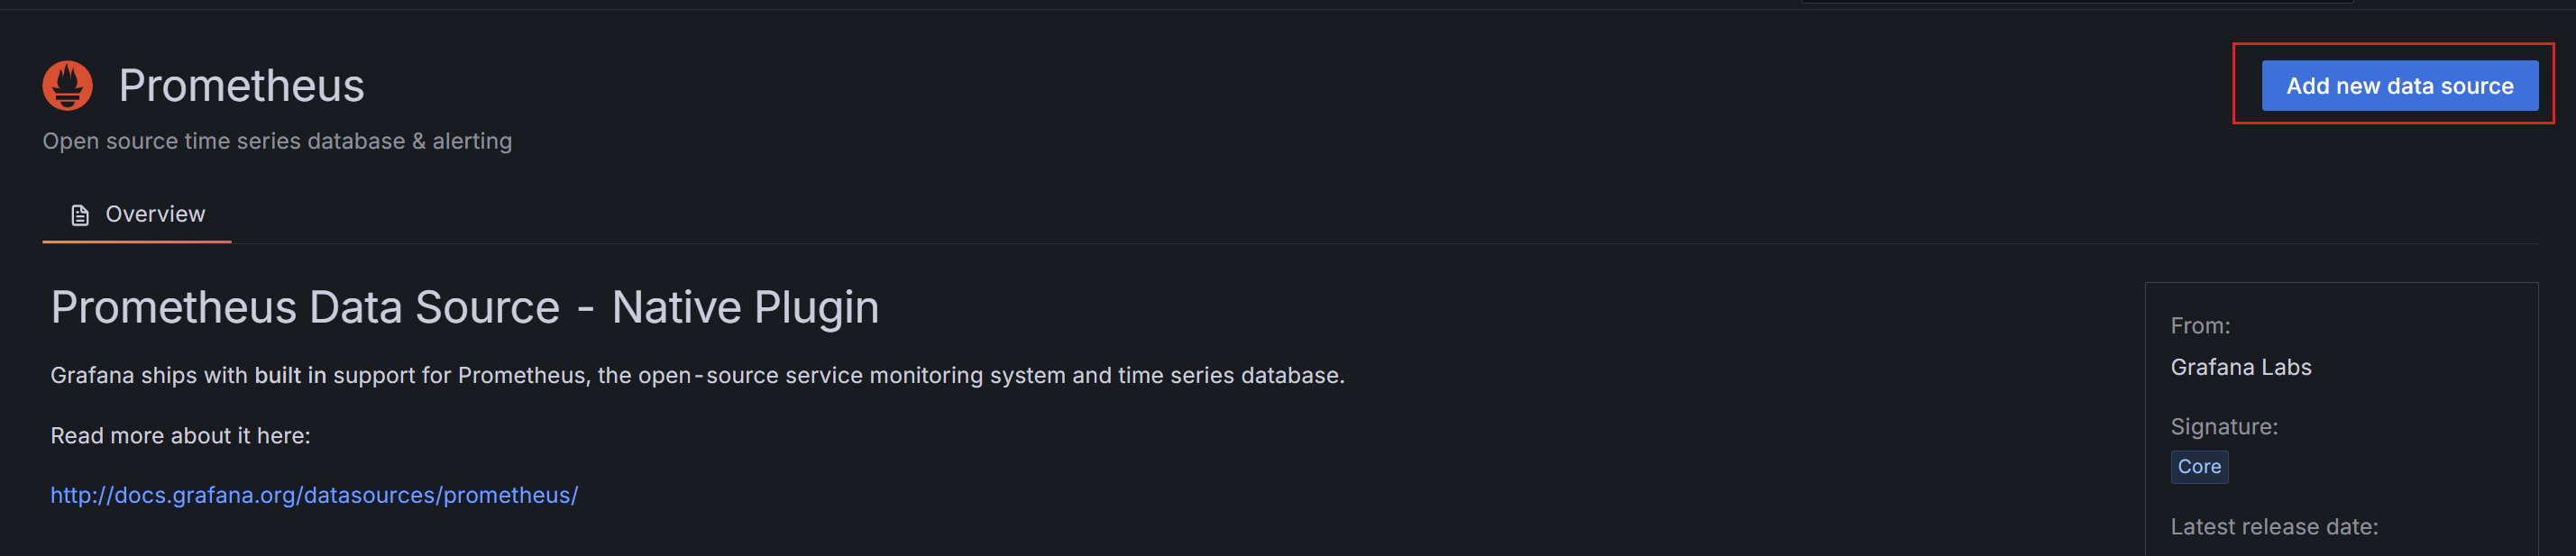
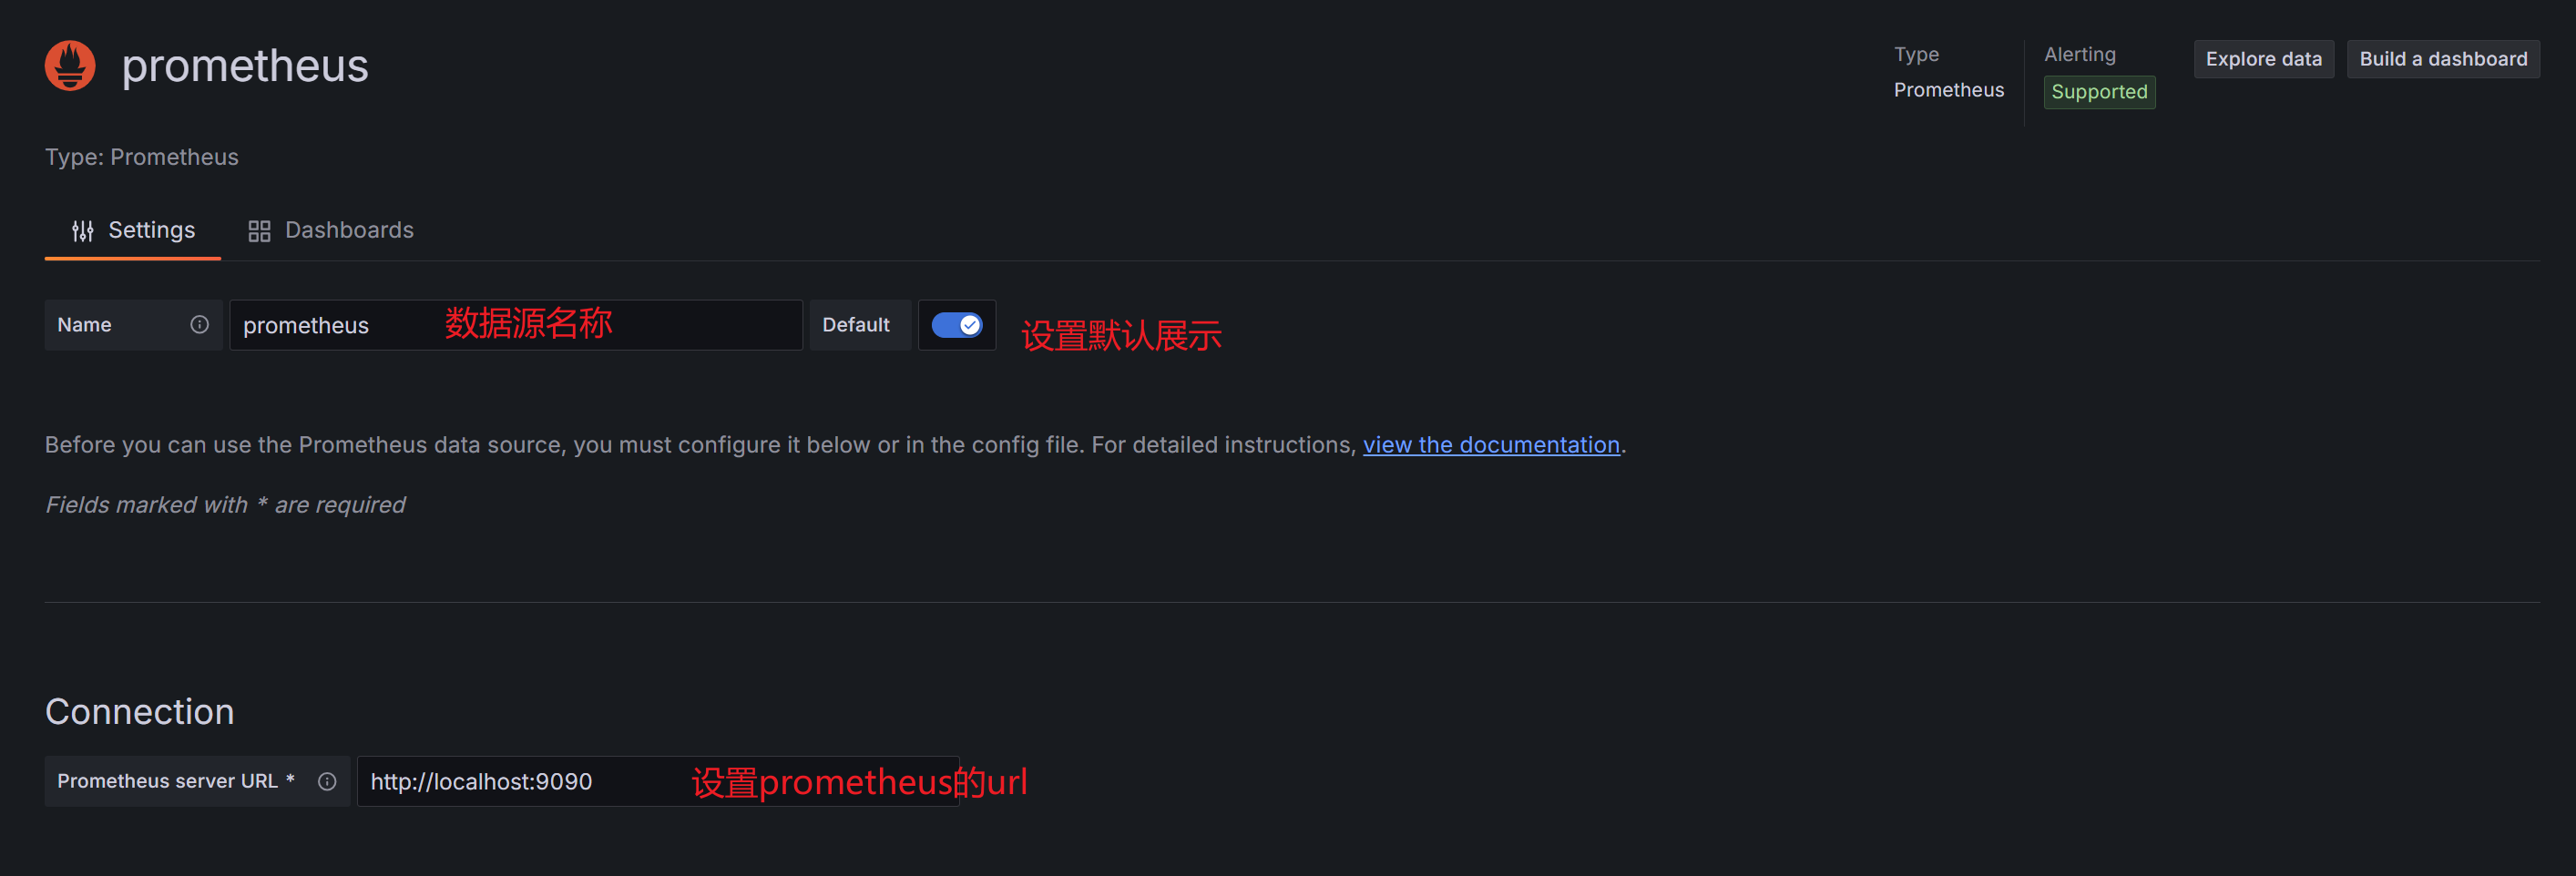
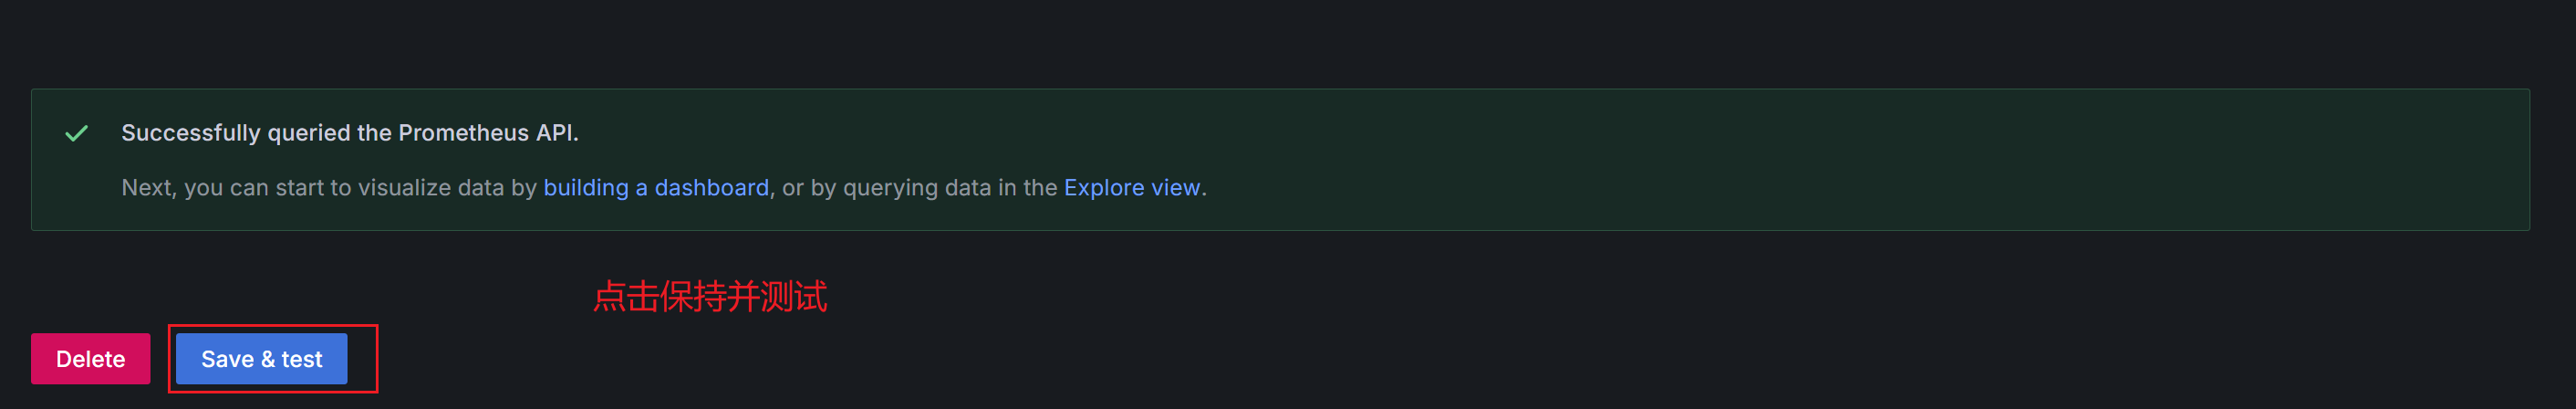
根据如图步骤进行添加:
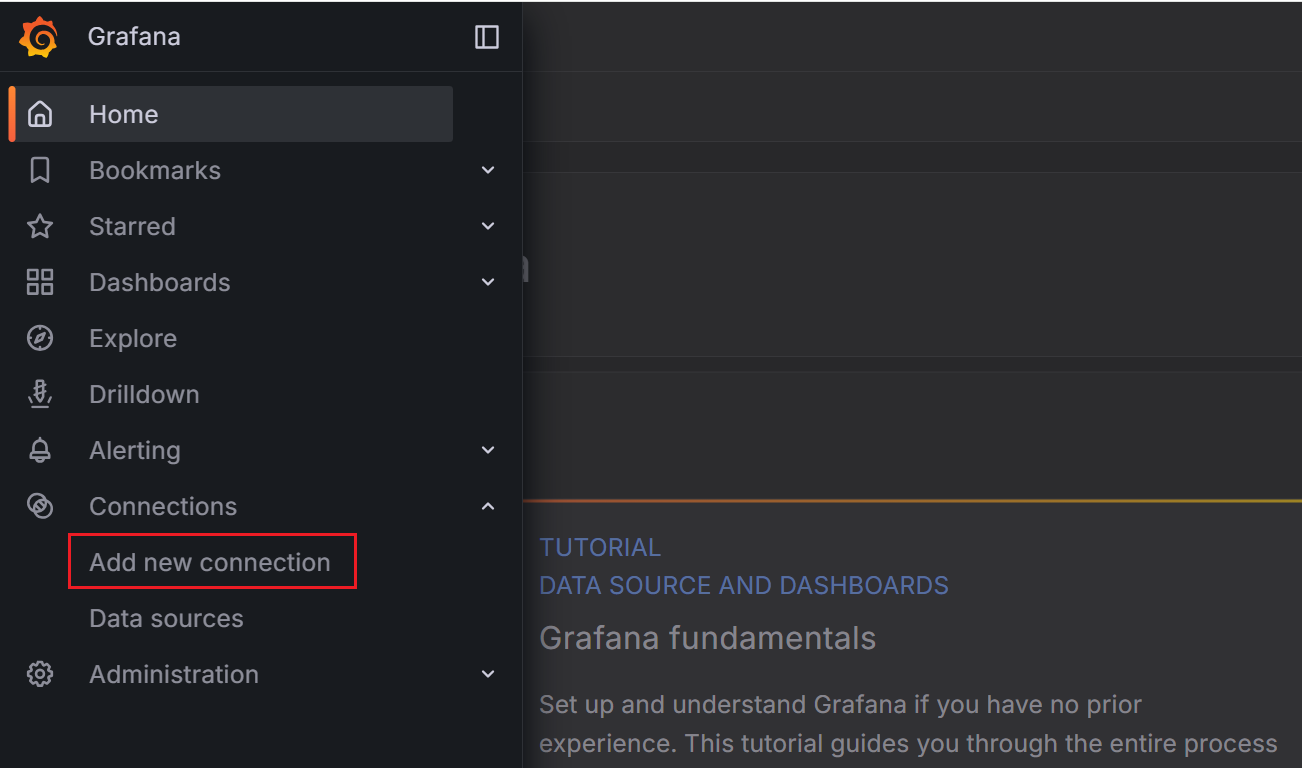
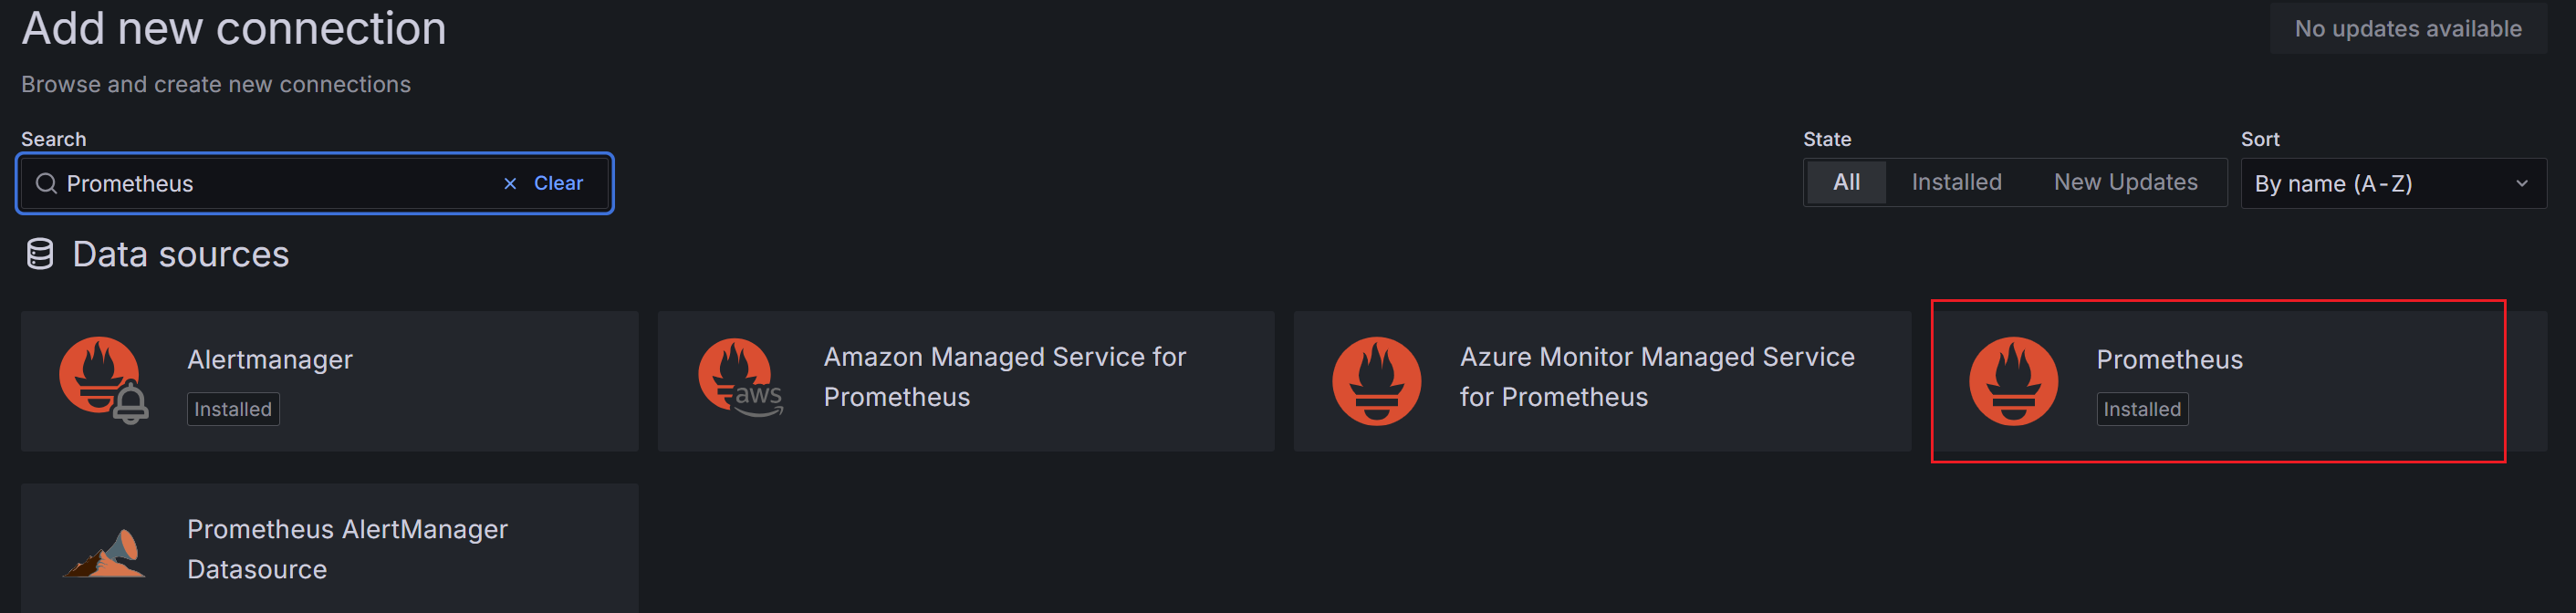
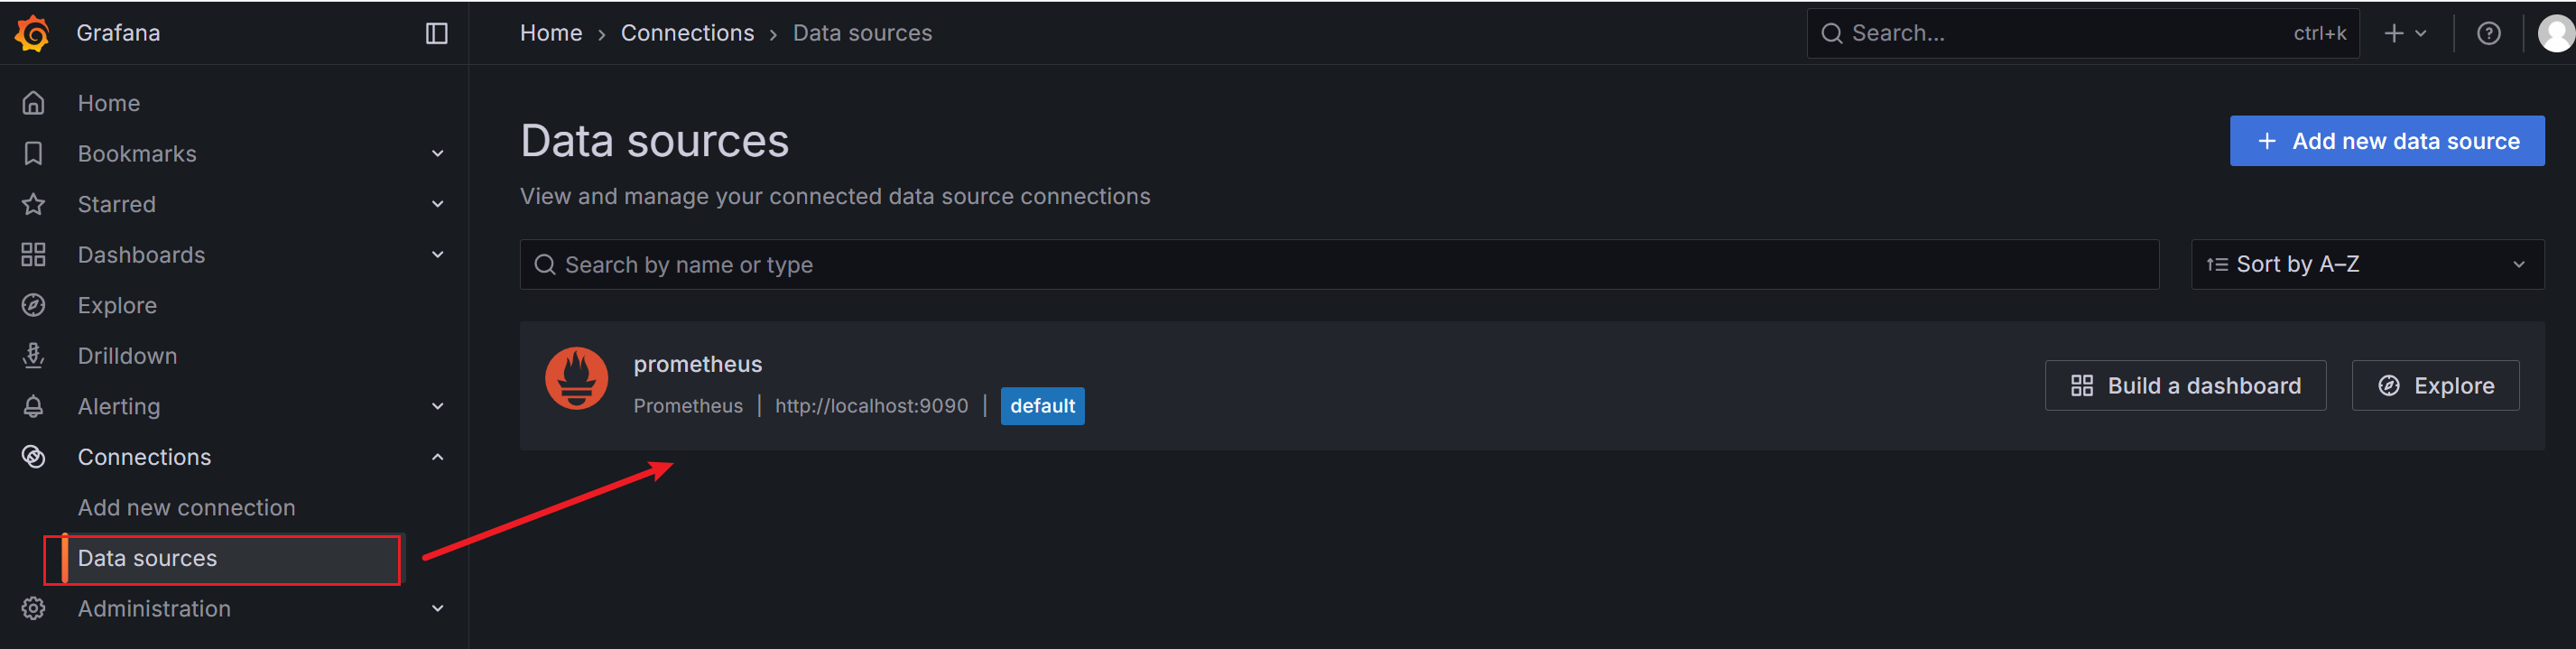
在“Data sources” 查看所有的数据源。
其他的配置阅读Grafana 的文档进行学习
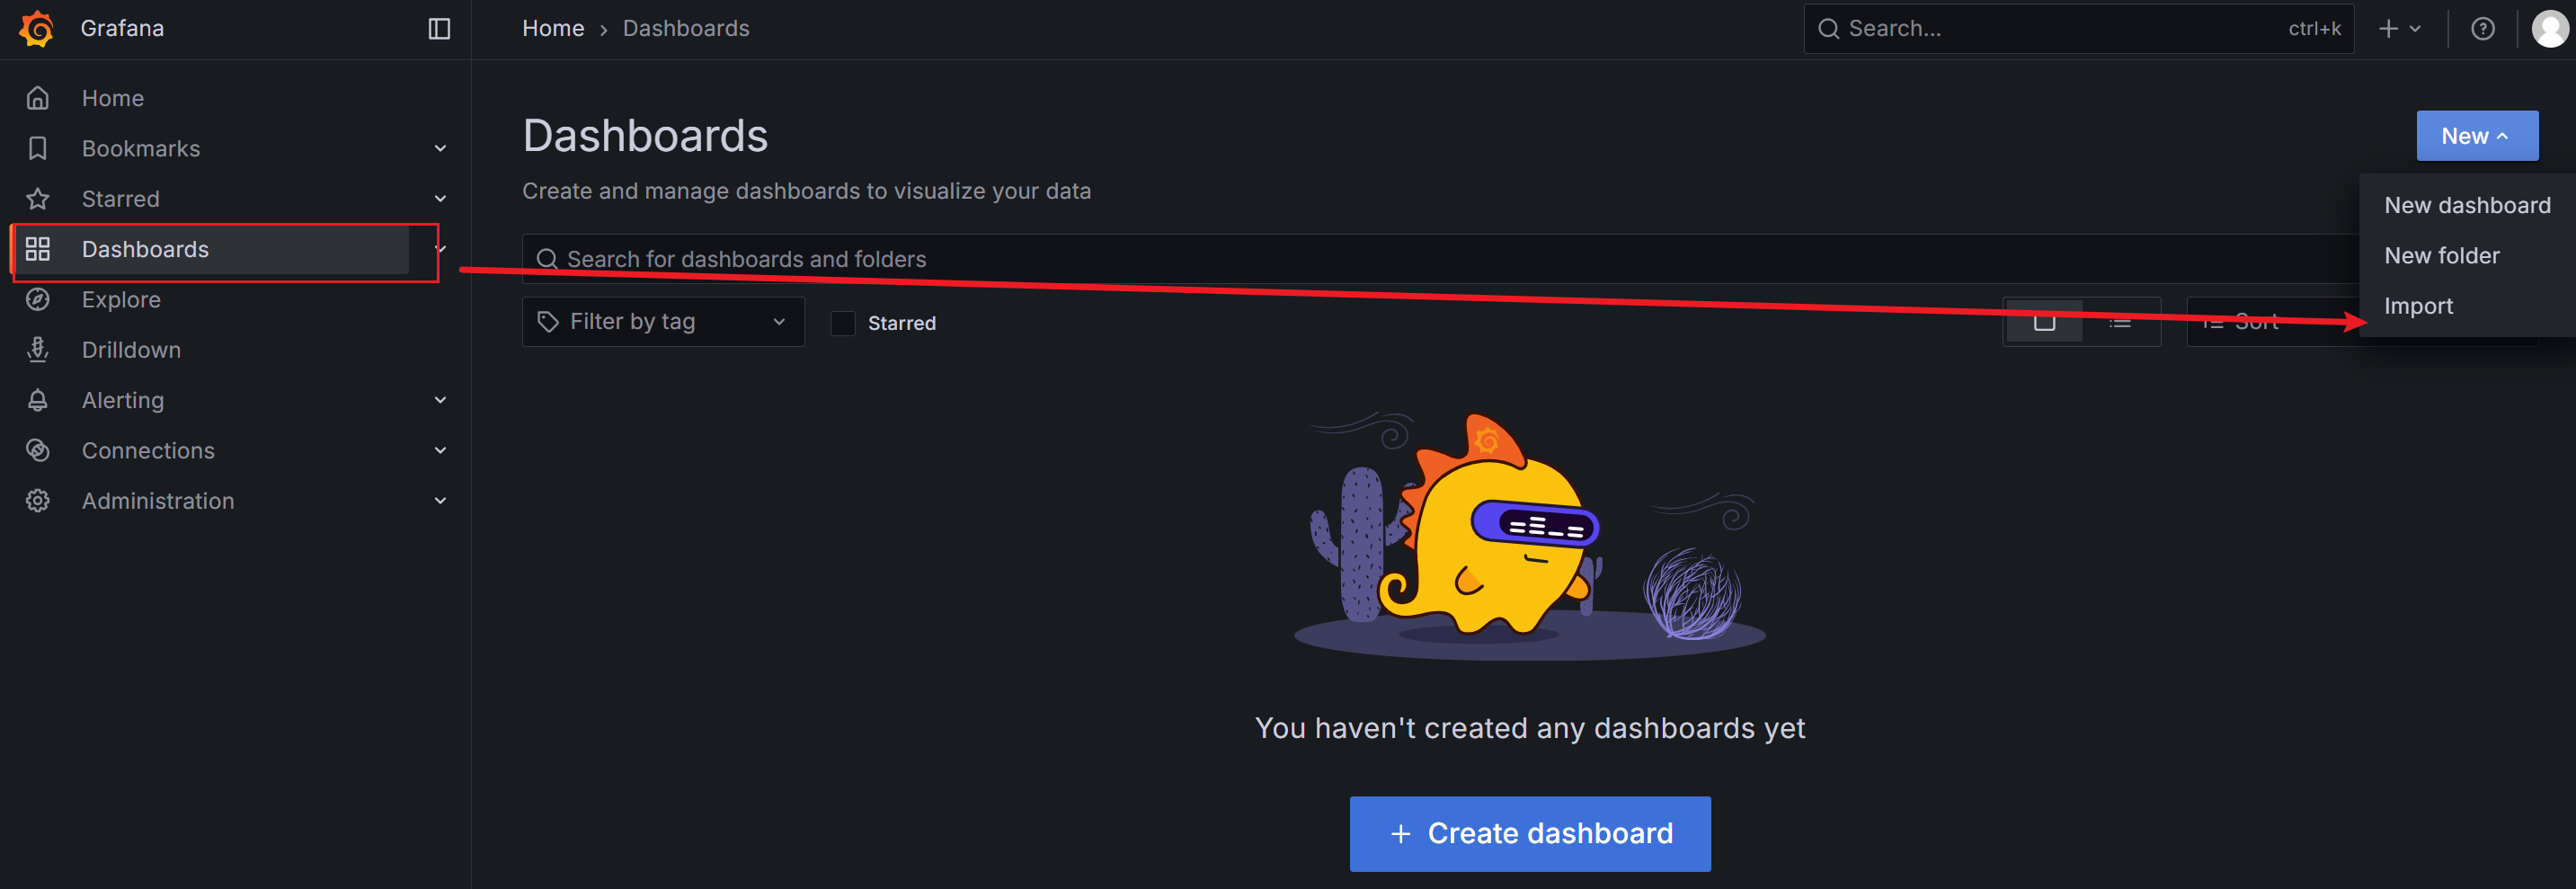
导入仪表盘
更多操作阅读文档:https://grafana.com/docs/grafana/latest/dashboards/build-dashboards/import-dashboards/#discover-dashboards-on-grafanacom
Grafana 提供的所有仪表盘:https://grafana.com/grafana/dashboards
选择合适的仪表盘,使用 导入 ID 或者json文件:
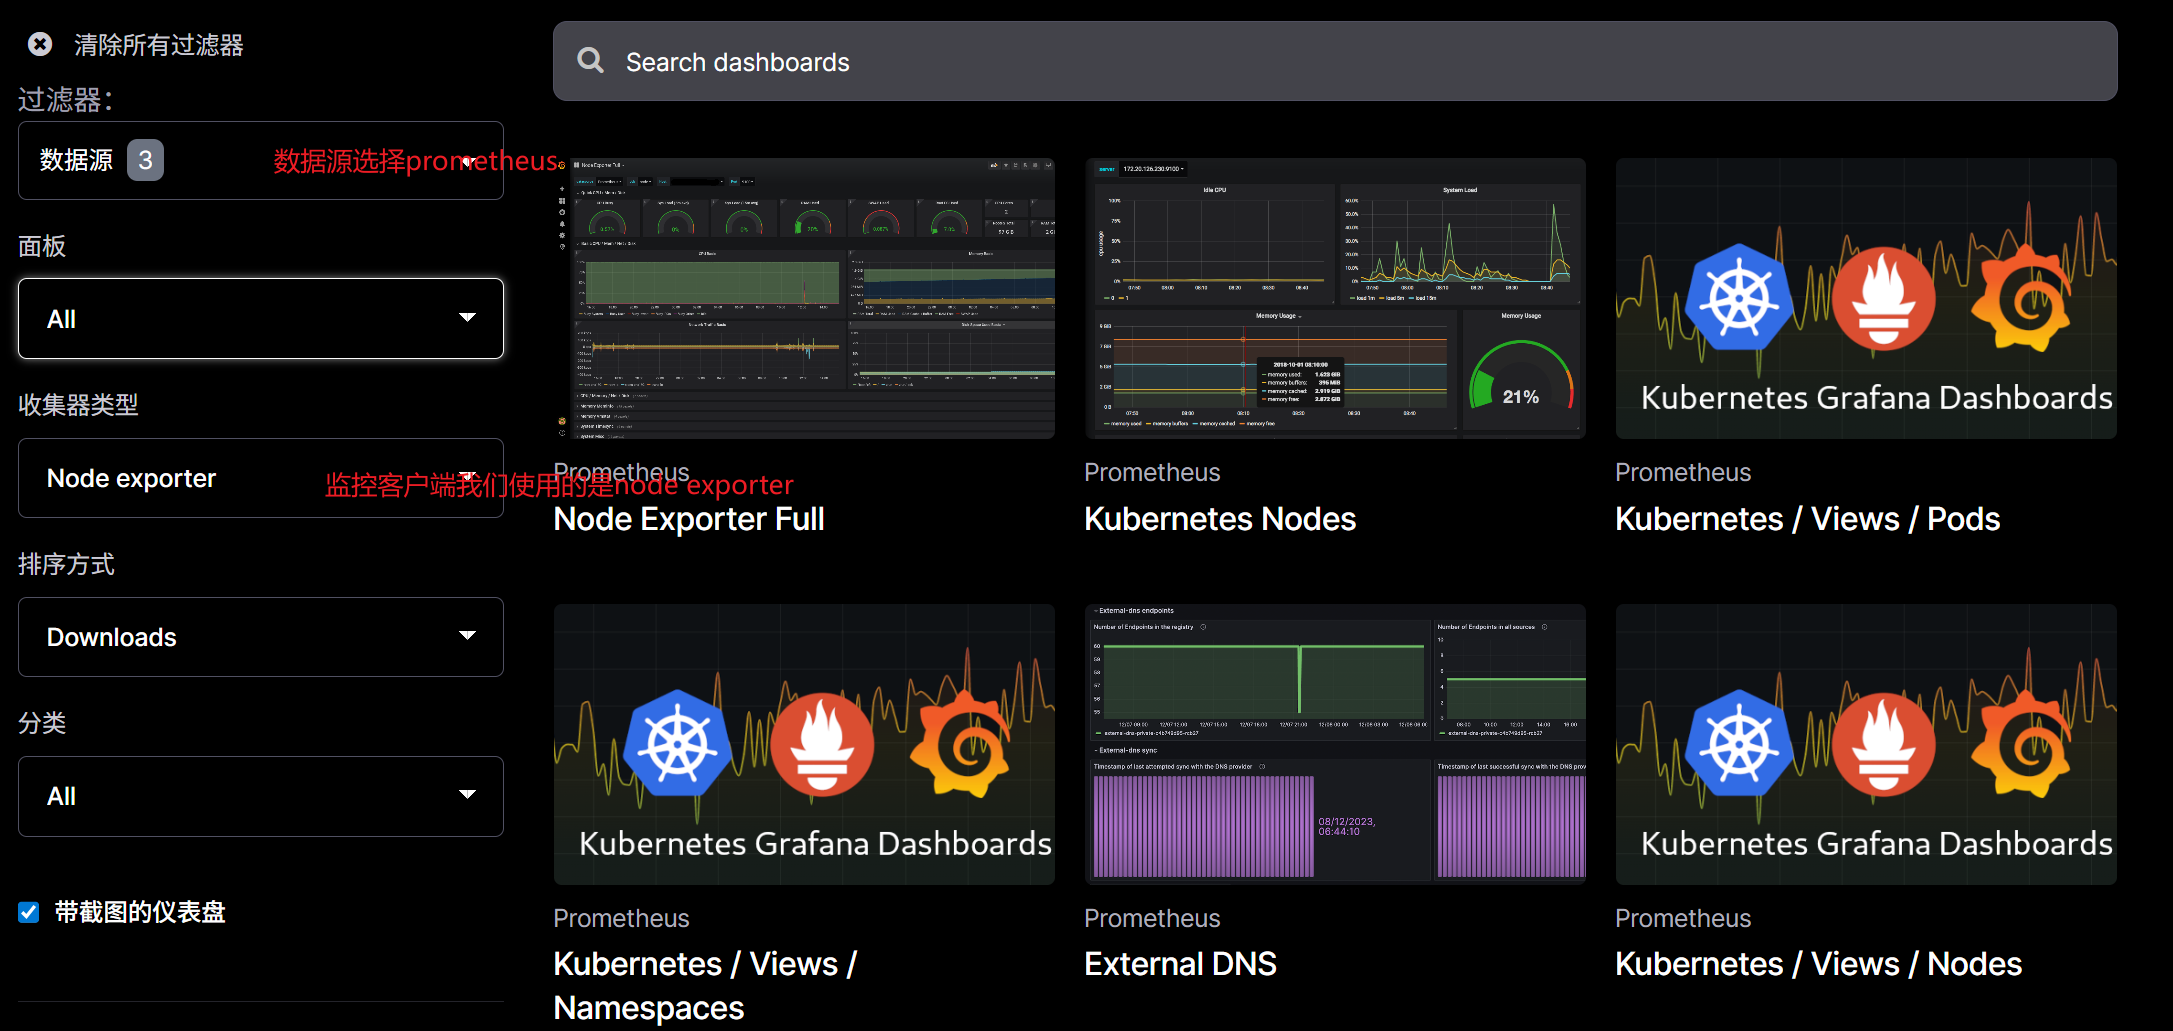
筛选合适的仪表盘:
这里我使用的是Node Exporter Full
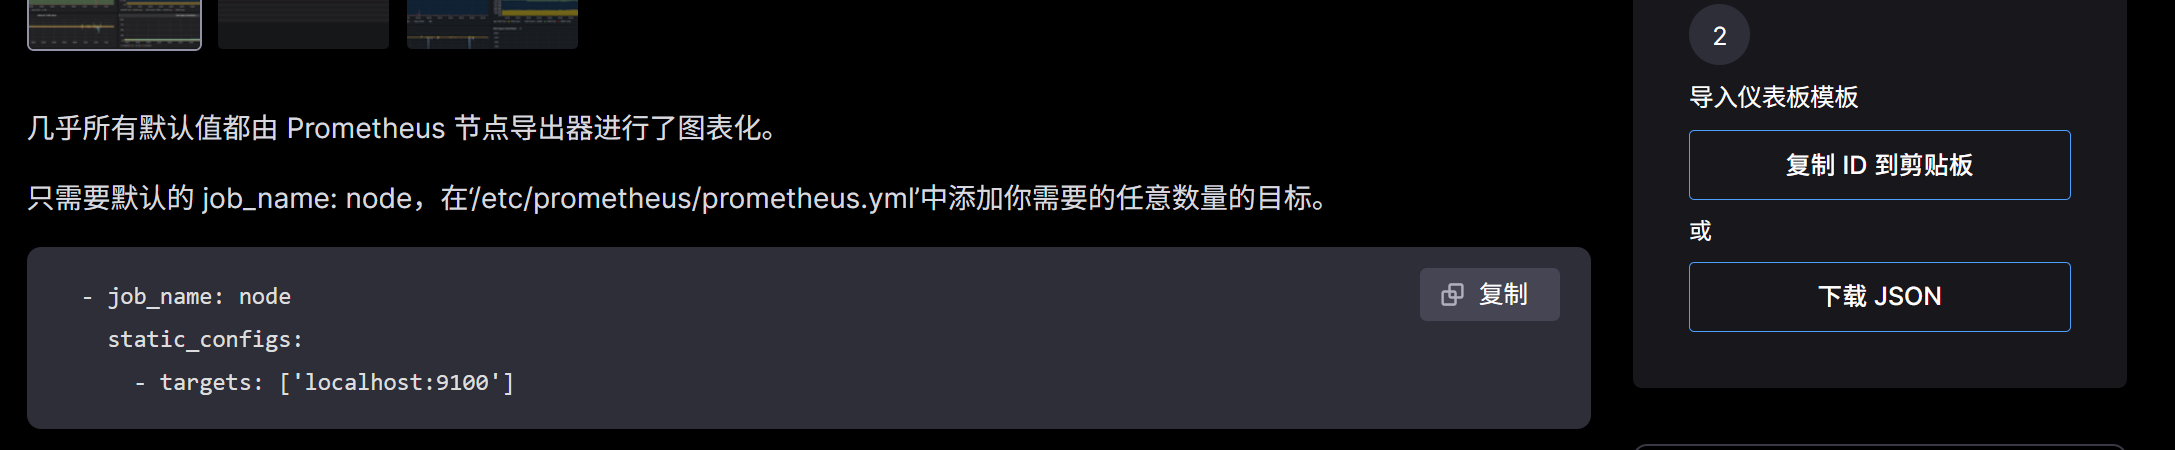
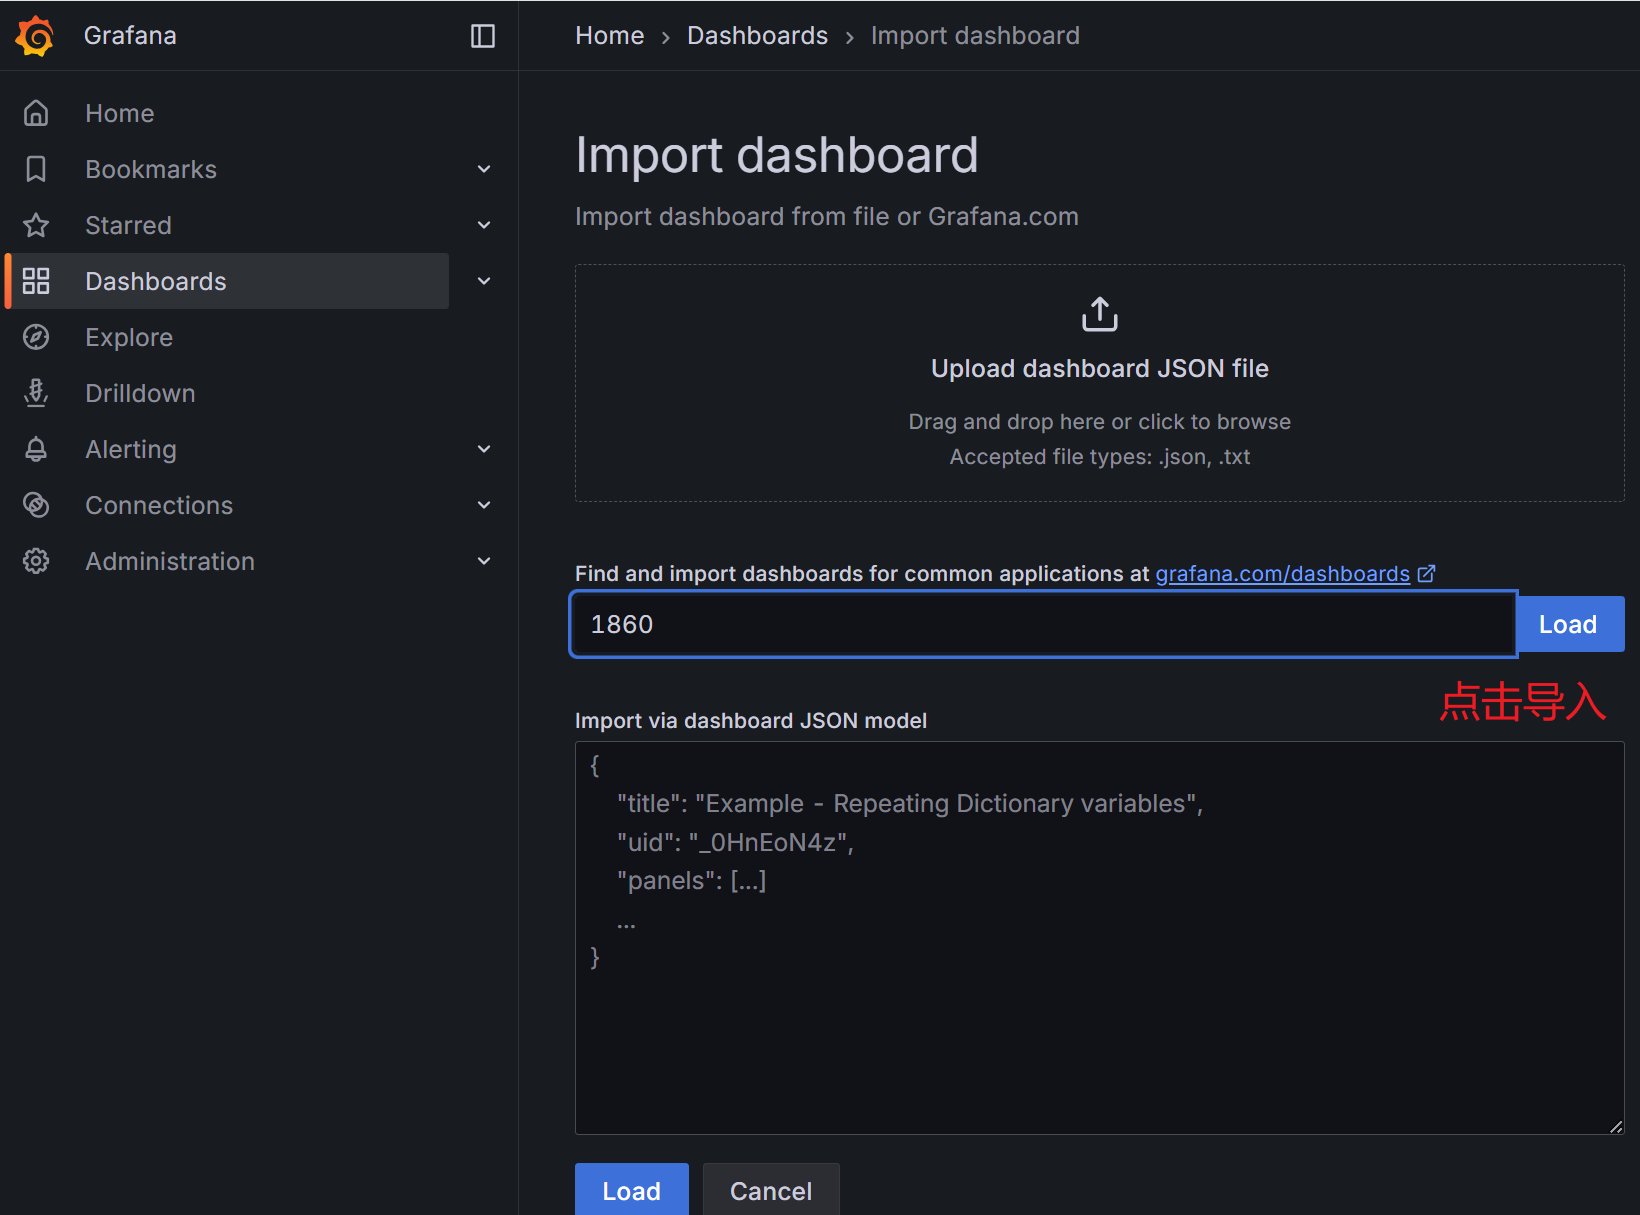
使用ID或者导入JOSN文件使用仪表盘:
在右侧可以看到ID和JOSN文件:
将仪表盘导入到Prometheus
导入ID
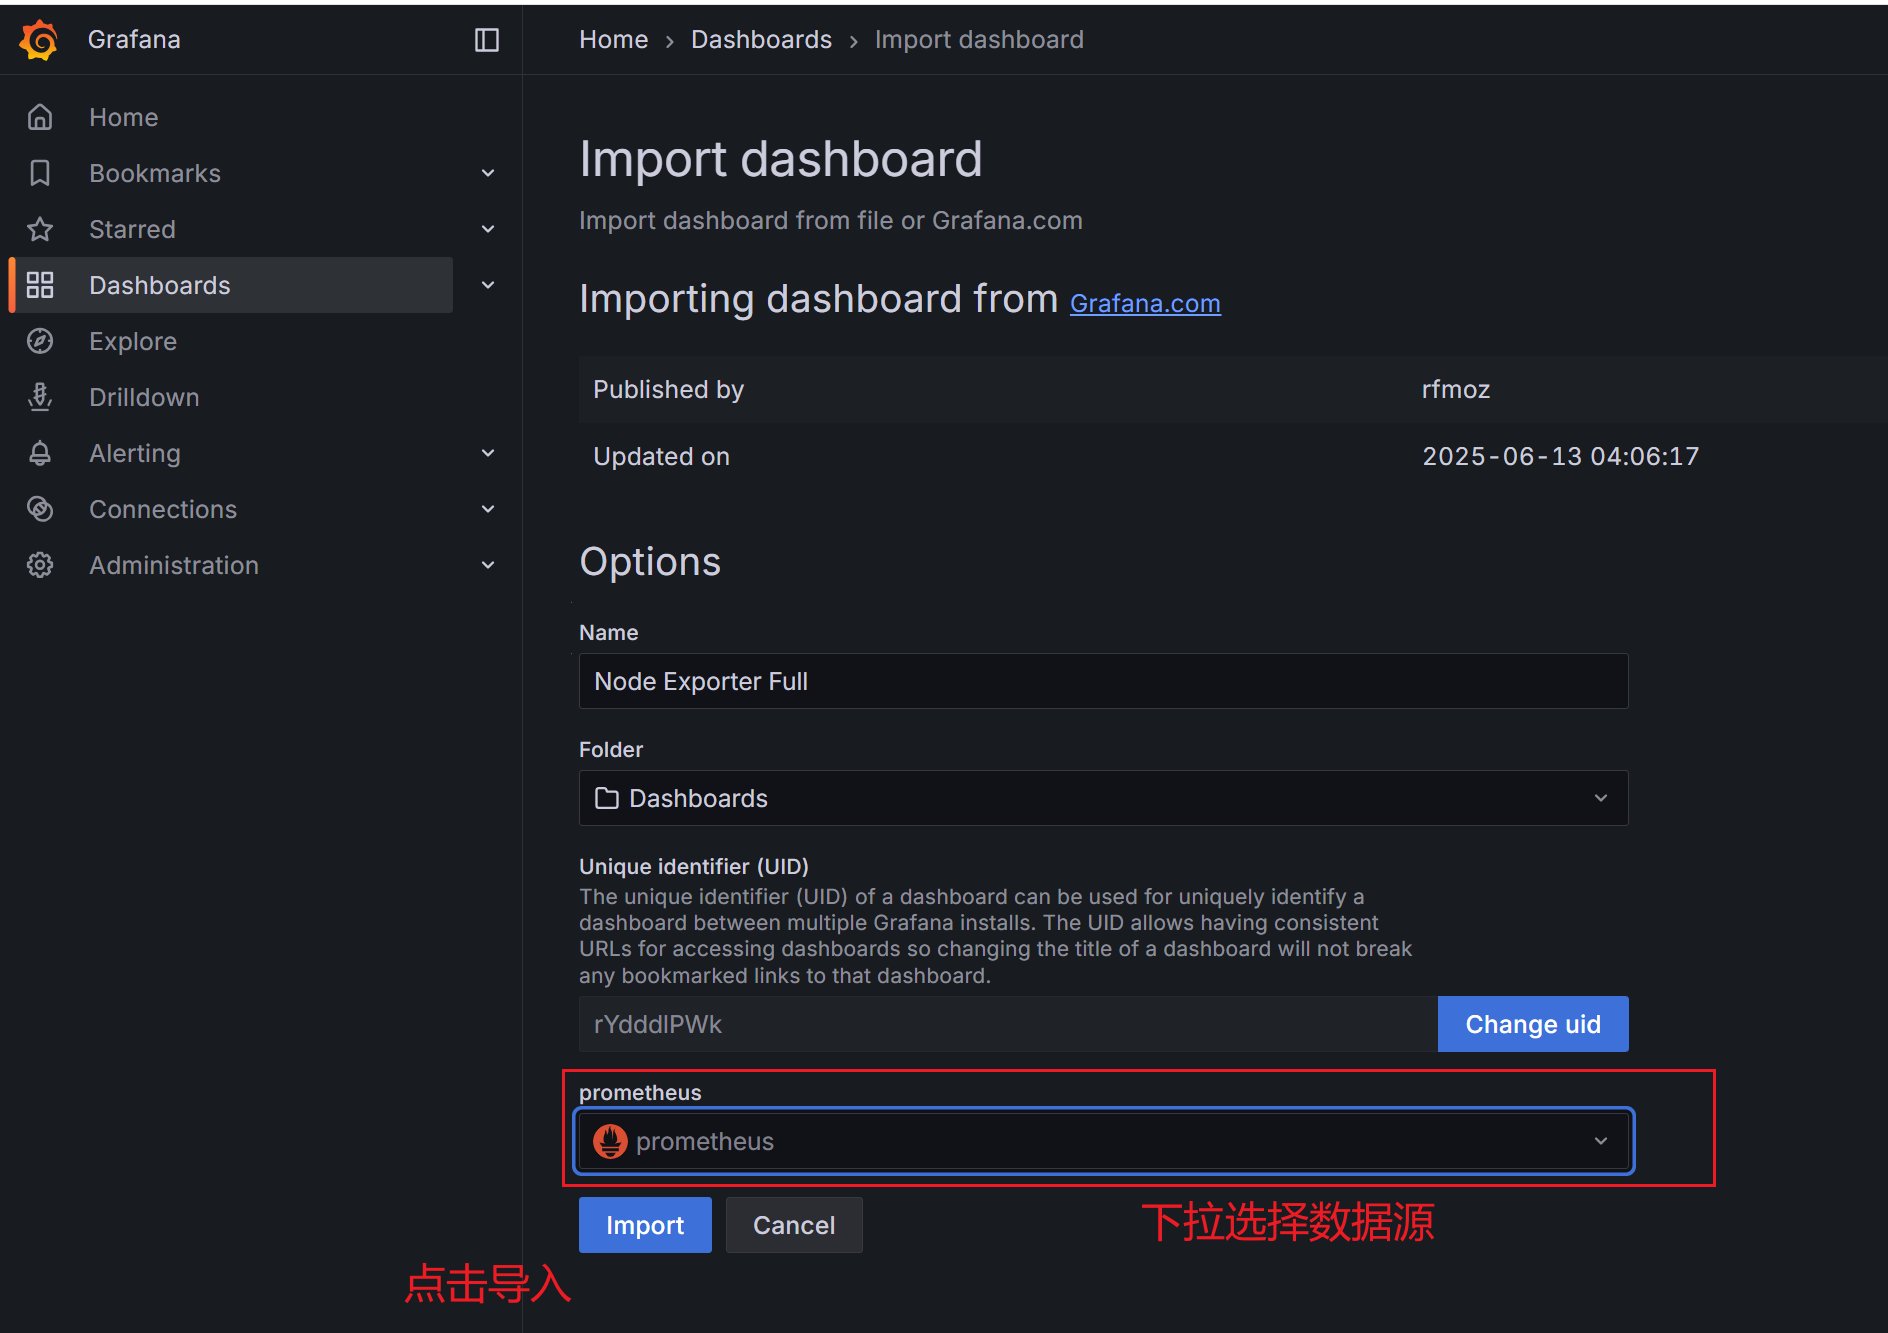
仪表盘导入成功:
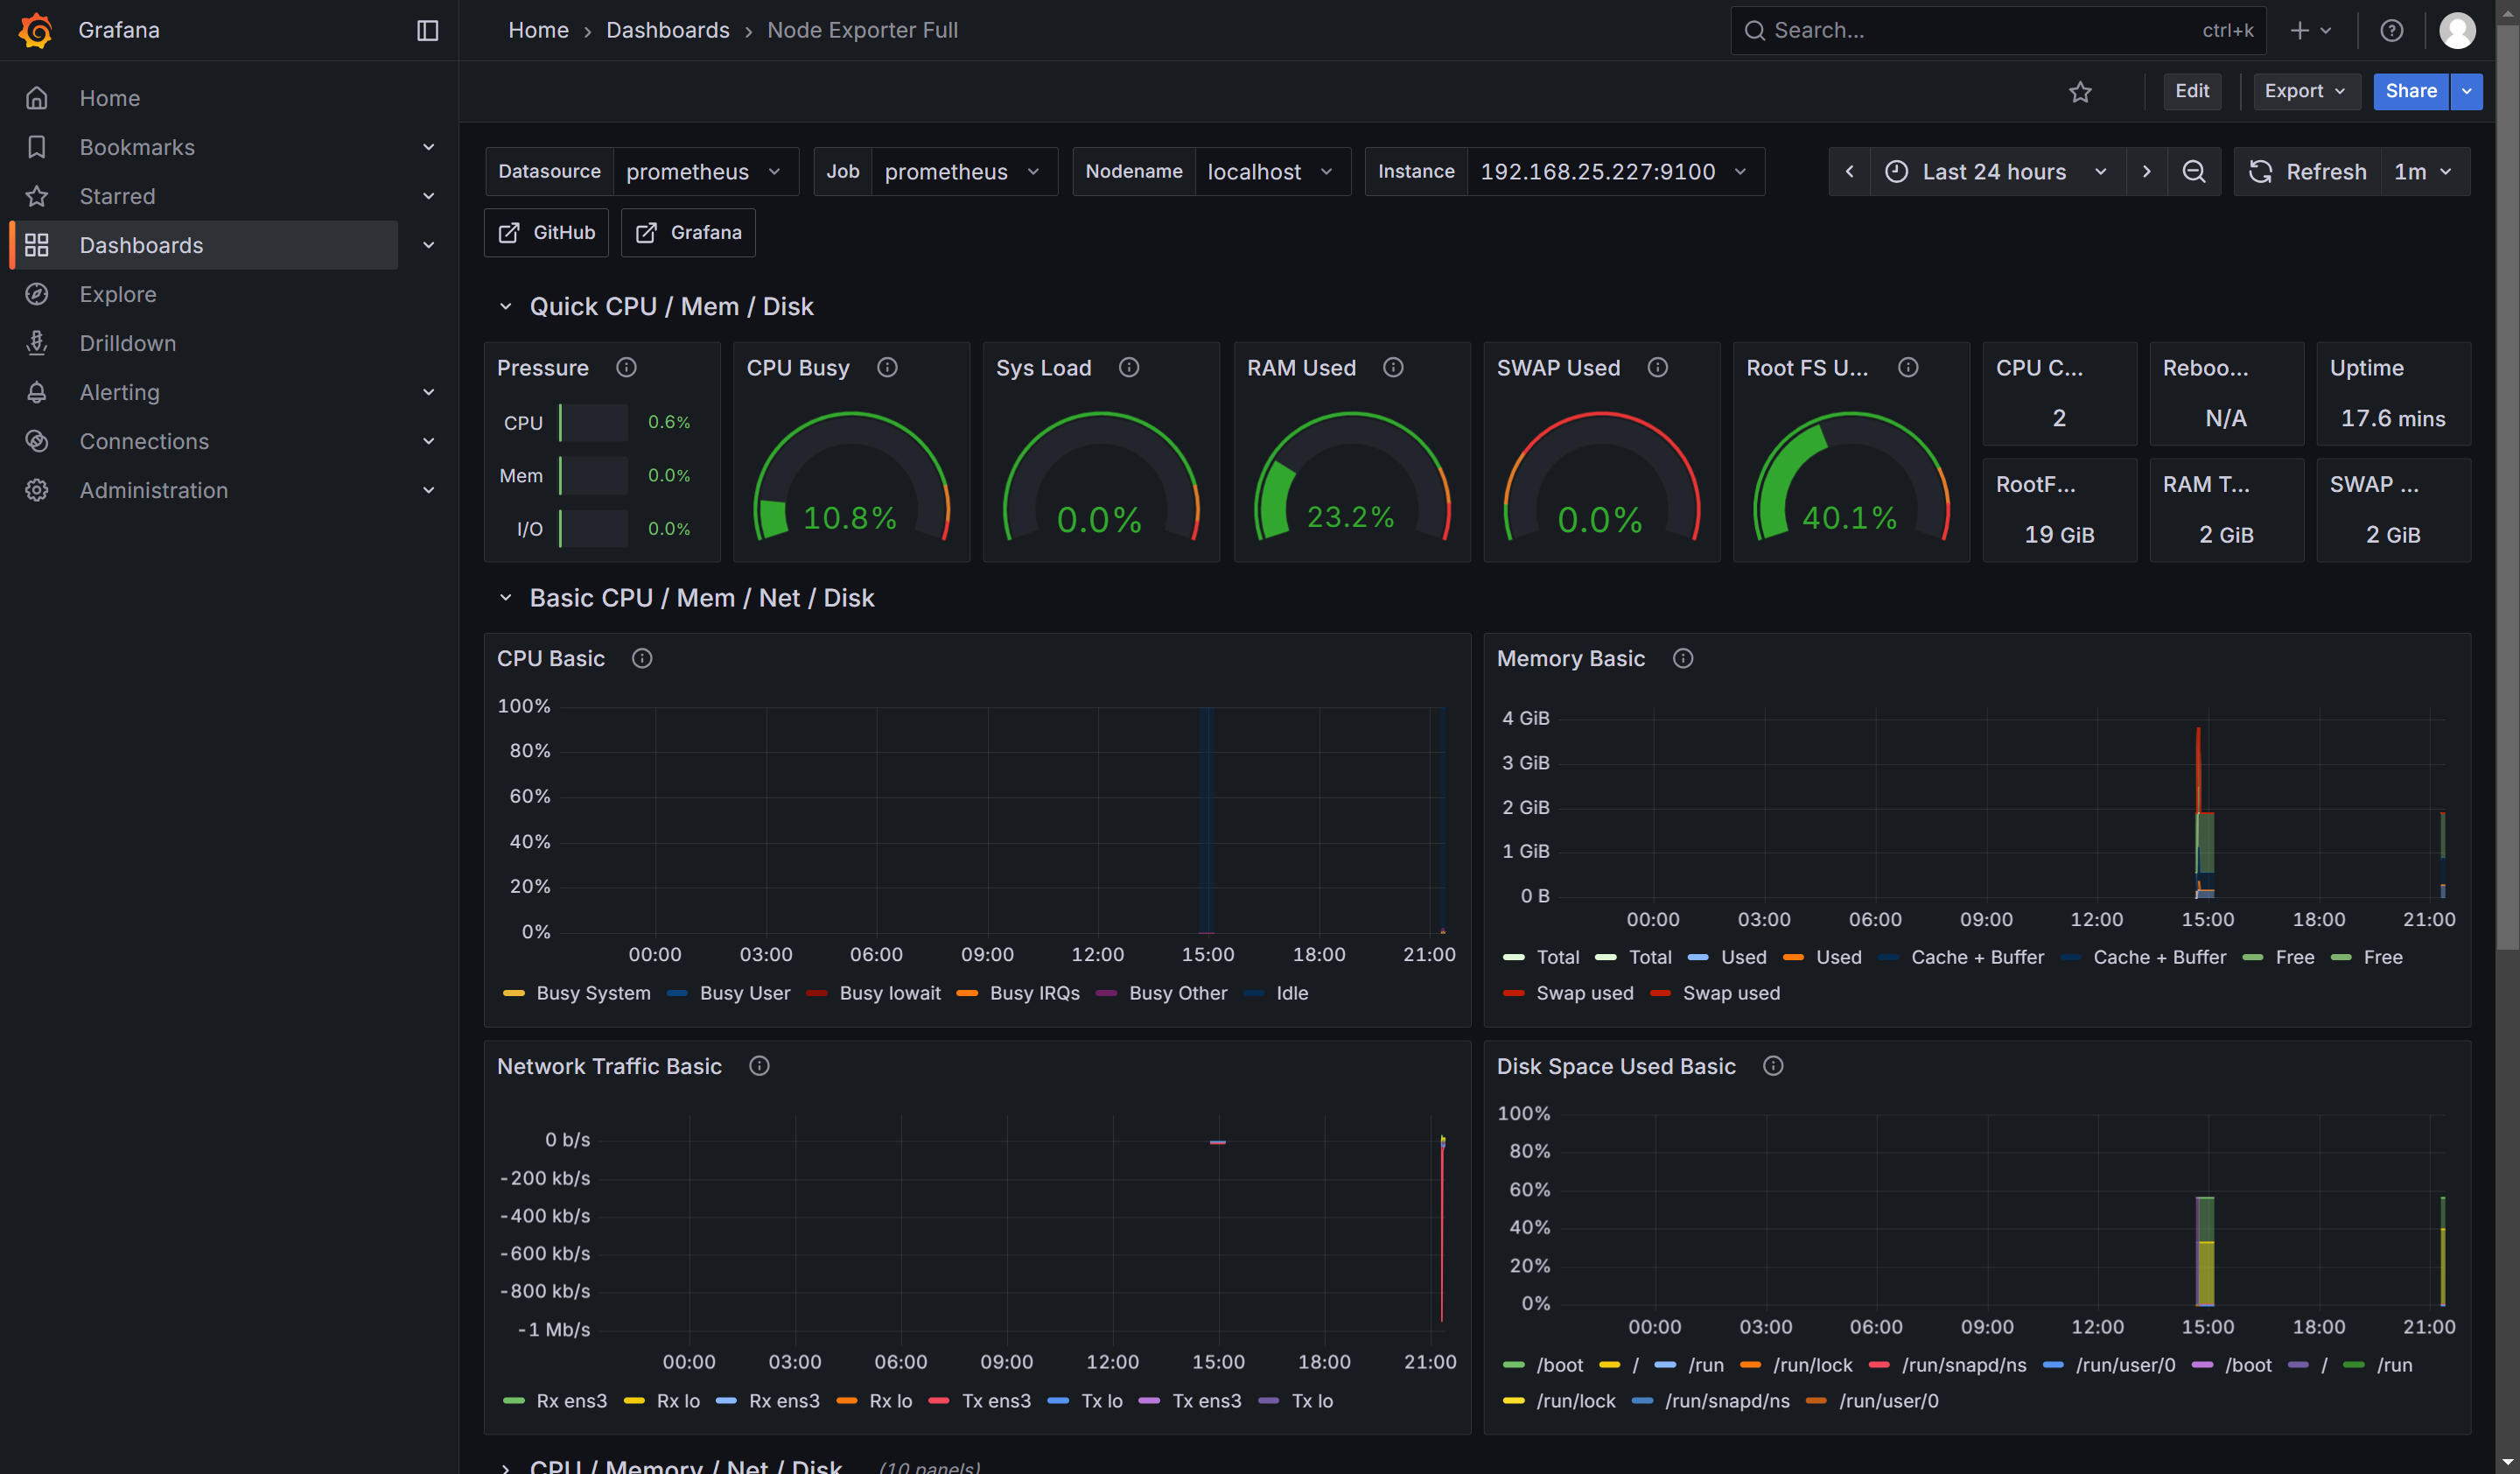
仪表盘就到这里就导入成功了。
发现目前的仪表盘无法同时显示所有主机的监控情况,所有查看了一下Grafana 提供的所有仪表盘发现了一个可以提供所有主机监控的仪表盘:https://grafana.com/grafana/dashboards/11074-node-exporter-for-prometheus-dashboard-en-v20201010/
这个仪表盘有中英文两个版本:
中文:16098
英文:11074
导入参考上面的内容:
我已经导入了
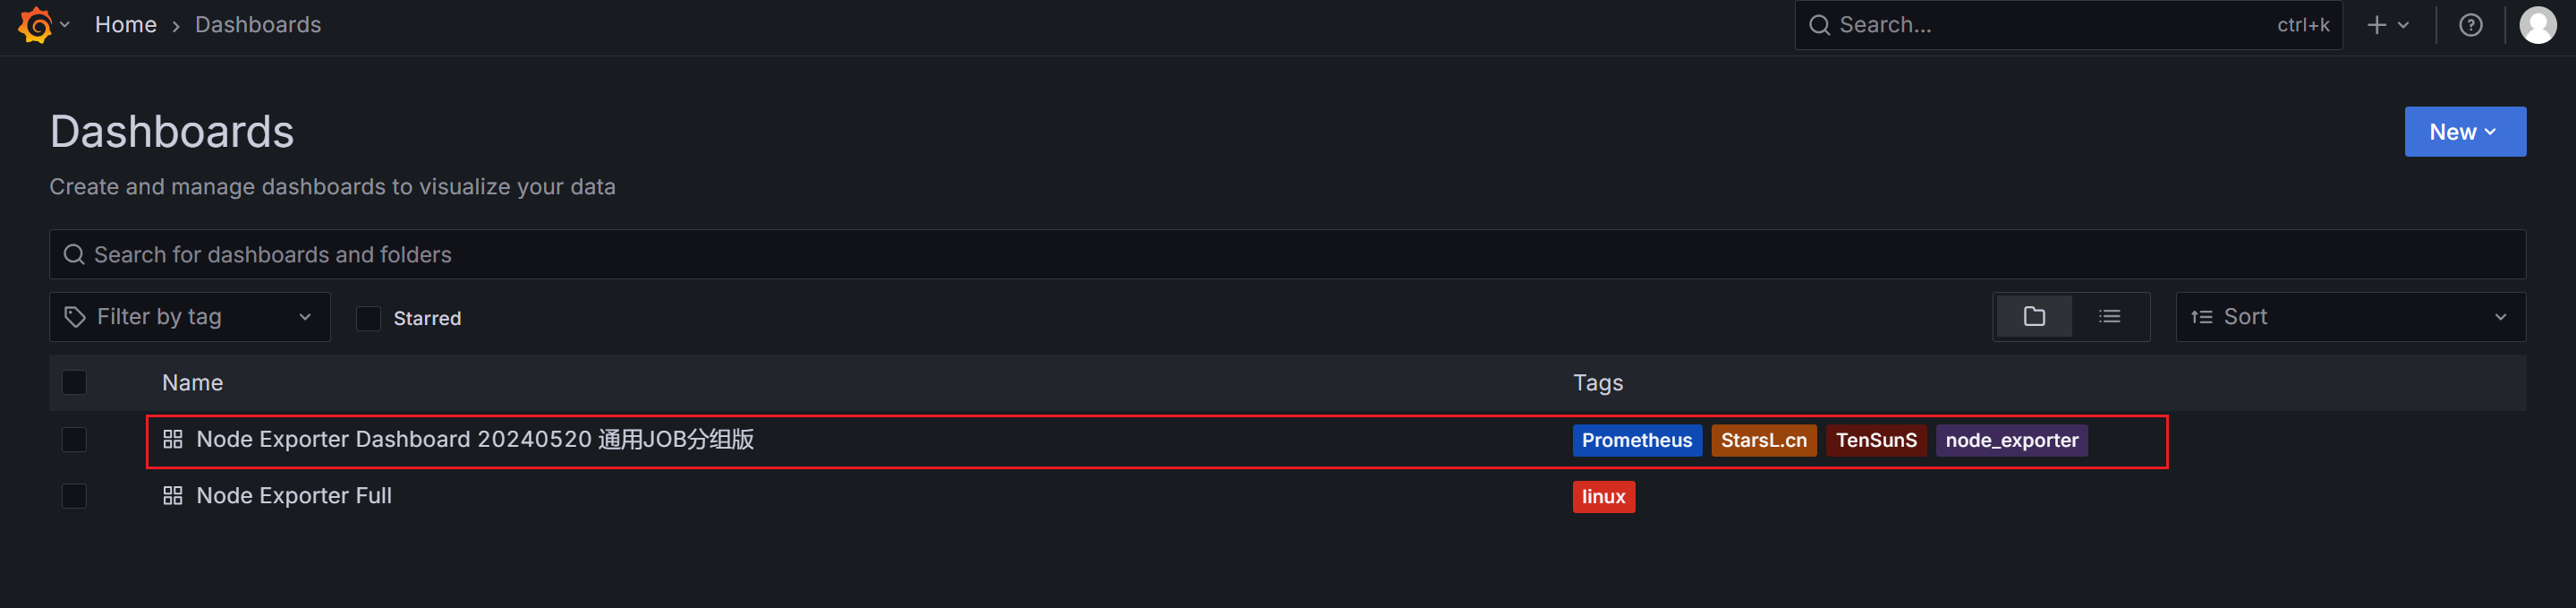
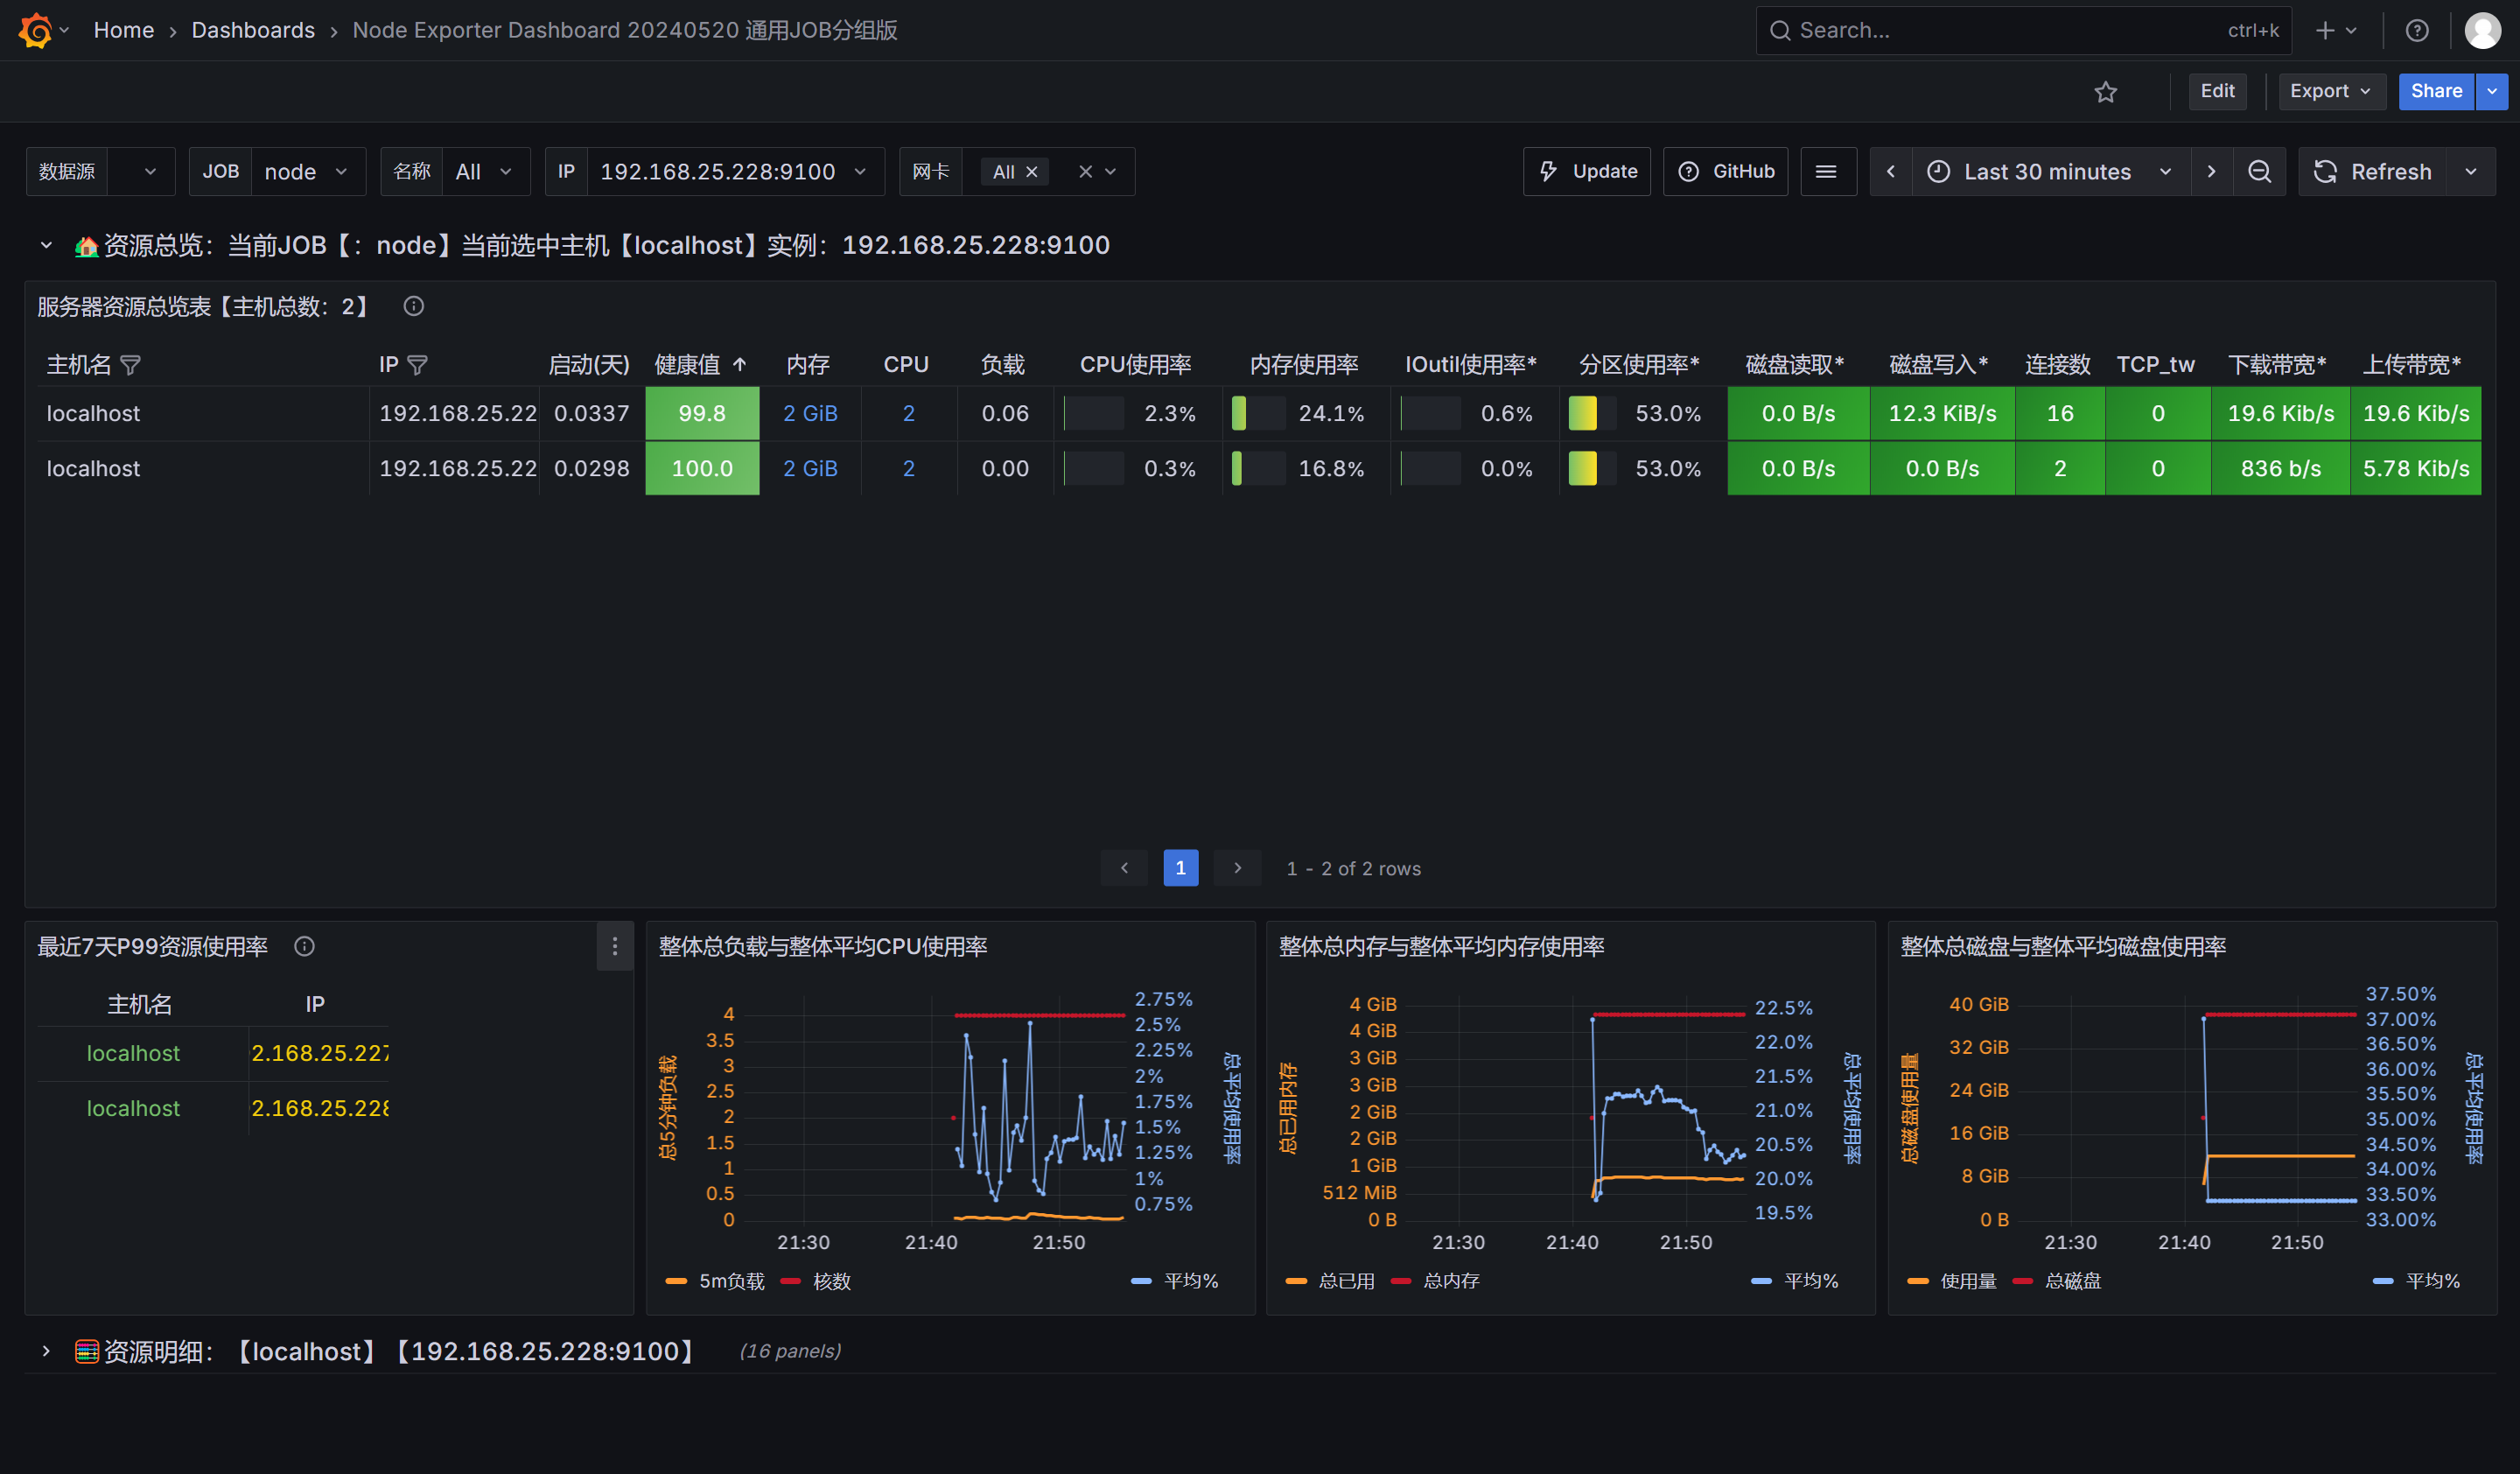
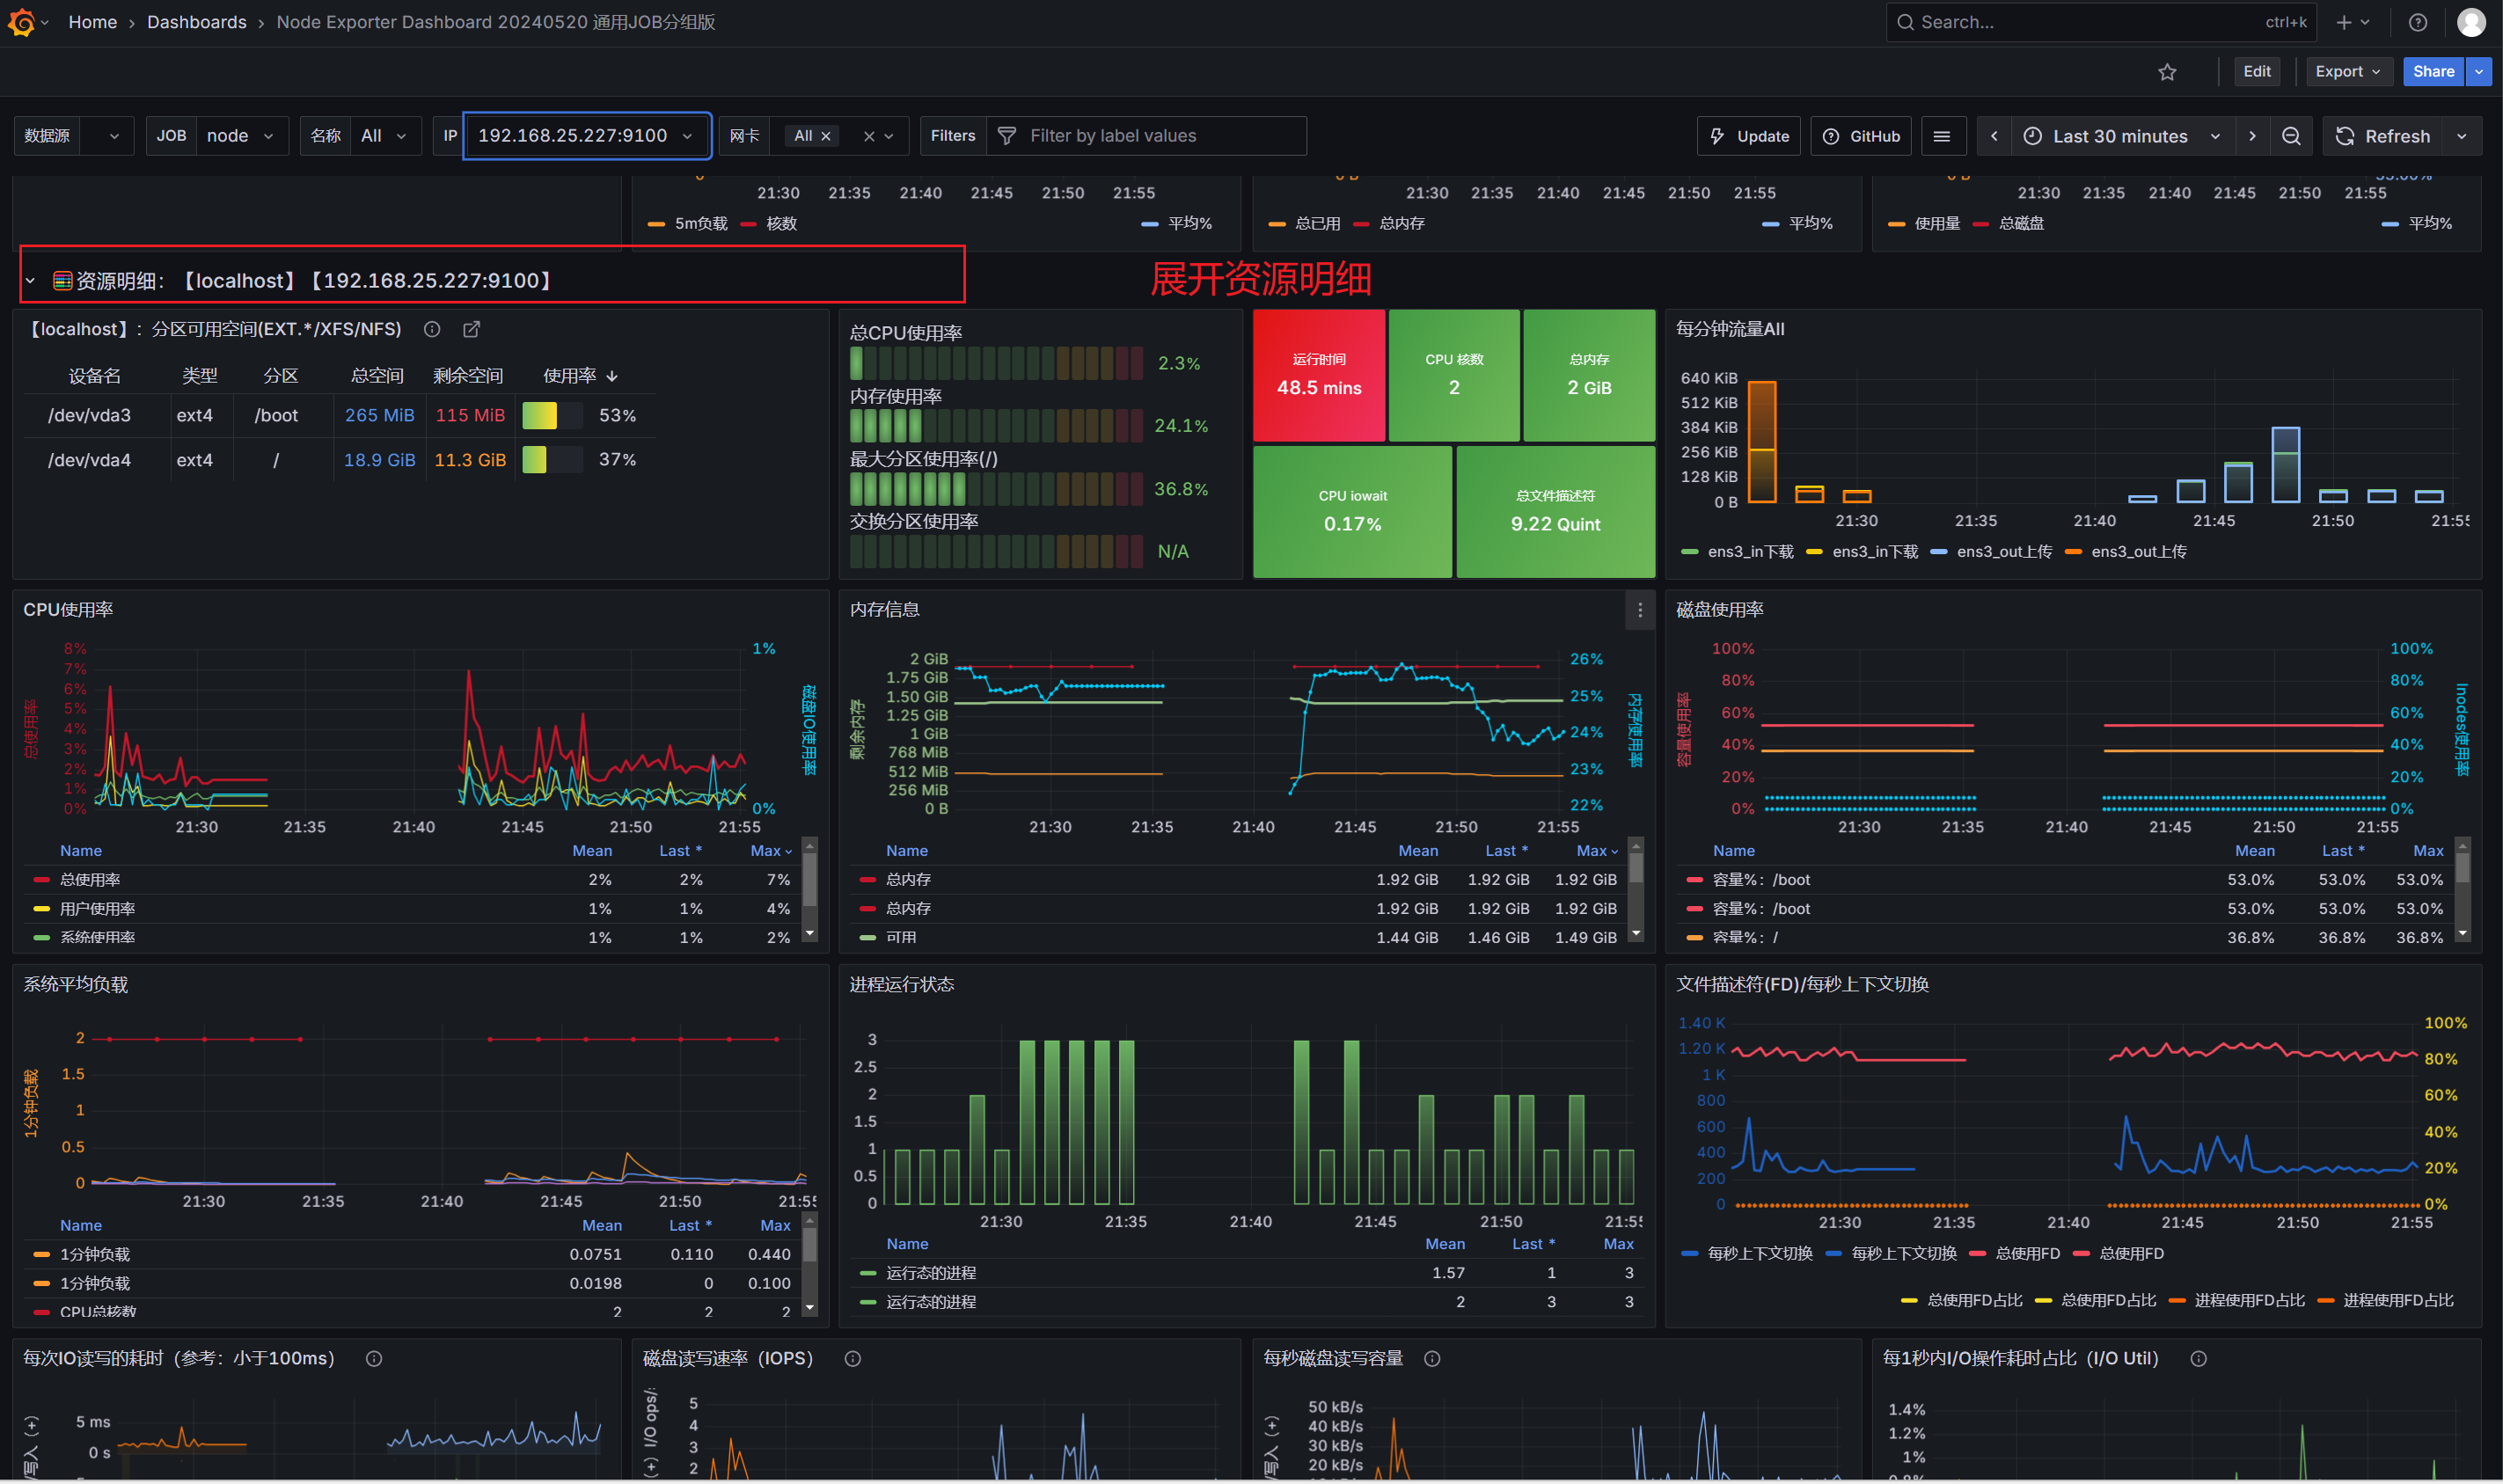
查看导入效果:
今天就到这里了,后续会继续更新Prometheus相关知识