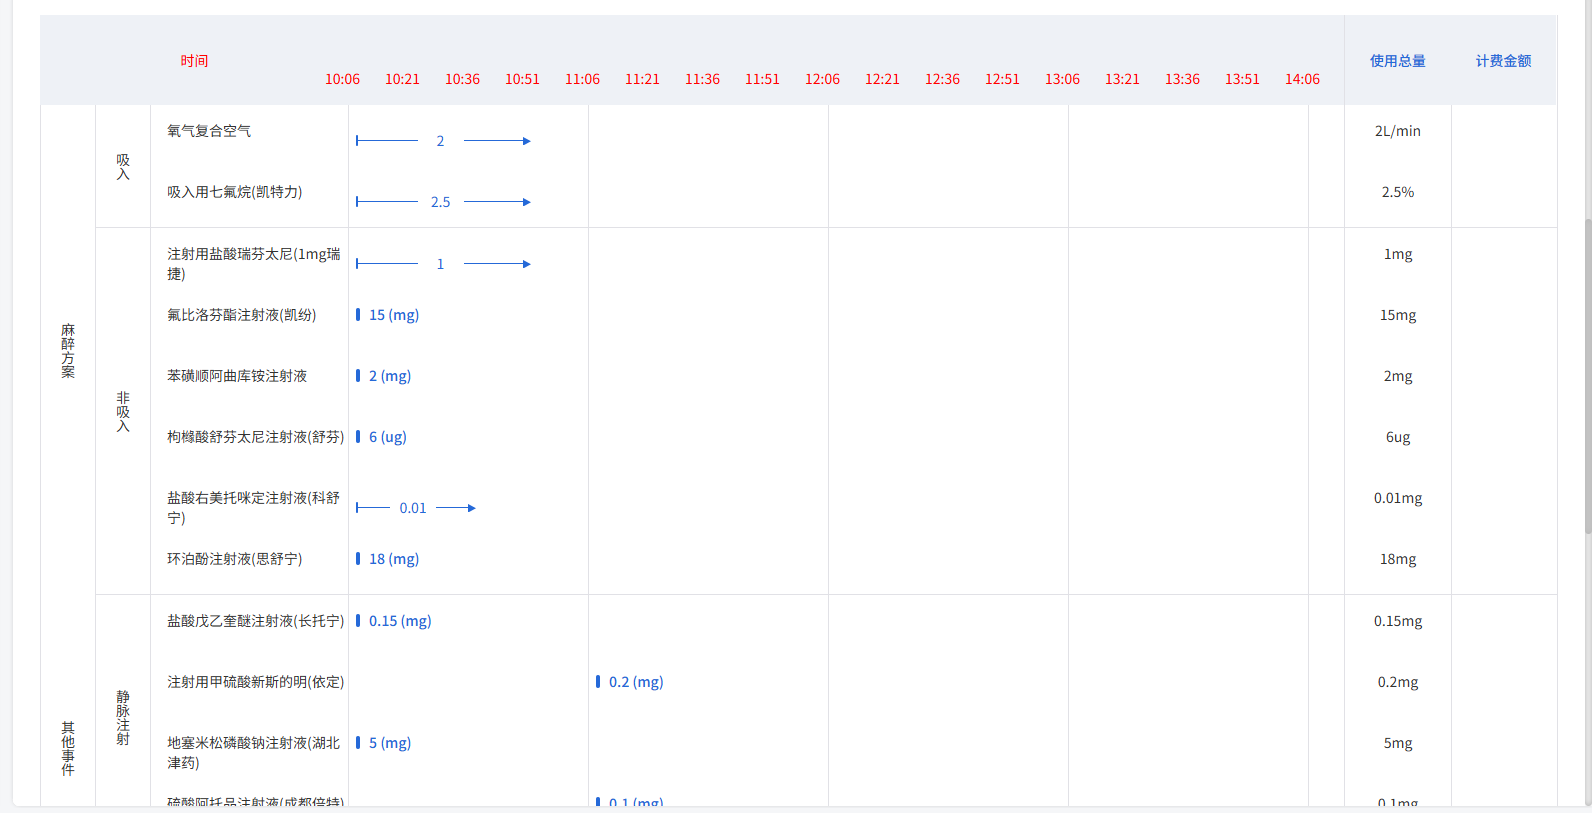
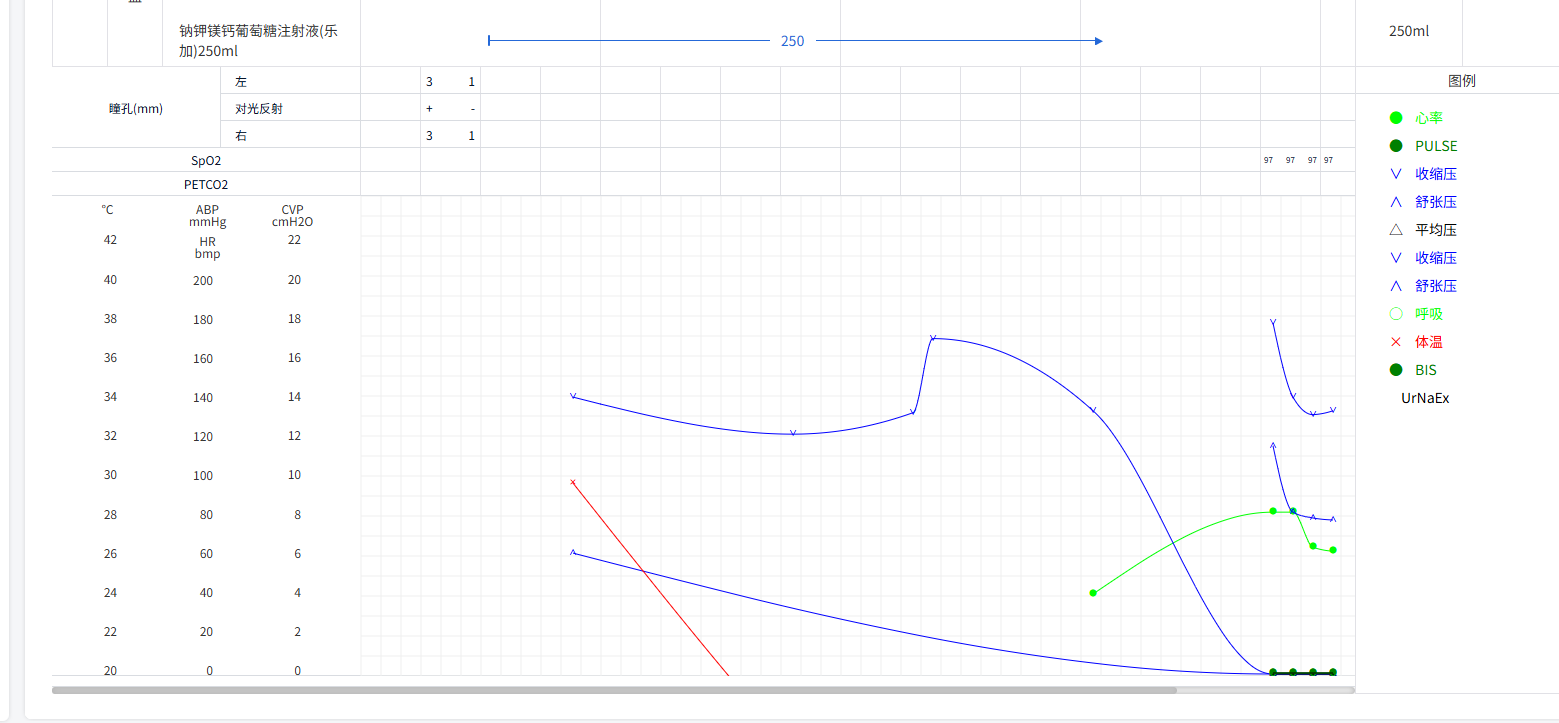
前端医疗生命体征
折线图 + 网格背景 + 自定义刻度三个y轴
D3.js可以完全自定义坐标轴、网格、折线、点的样式和交互
echarts不支持自定义网格背景,才换的d3
1.创建svg容器
const svg = d3.select(this.$refs.chartContainer).append('svg').attr('width', width).attr('height', gridHeight);2. 创建y轴(scale)
- 使用
d3.scaleLinear()分别为3个Y轴定义比例尺。 - 根据数据范围设置对应的域(domain)和范围(range)。
// y轴刻度范围(根据你的需求调整)const cvpTicks = d3.range(0, 22 + 1, 2);const abpTicks = d3.range(0, 200 + 1, 20)const tempTicks = d3.range(20, 42 + 1, 2);// y轴比例尺const yScales = [d3.scaleLinear().domain([20, 42]).range([gridHeight - 49, 0]),//y轴高度d3.scaleLinear().domain([0, 200]).range([gridHeight - 90, 0]), //通过修改y轴最高点和y轴比例尺 数据,更改y轴刻度线d3.scaleLinear().domain([0, 22]).range([gridHeight - 49, 0])];// y轴生成器const yAxisGenerators = [d3.axisLeft(yScales[0]).tickValues(tempTicks).tickSize(0).tickPadding(6).tickSizeOuter(0),d3.axisLeft(yScales[1]).tickValues(abpTicks).tickSize(0).tickPadding(6).tickSizeOuter(0),d3.axisLeft(yScales[2]).tickValues(cvpTicks).tickSize(0).tickPadding(6).tickSizeOuter(0)];// 绘制y轴yAxisGenerators.forEach((yAxisGen, i) => {const g = svg.append('g').attr('class', 'axis').attr('transform', `translate(${yAxisXPositions[i] + (i === 1 ? 30 : i === 2 ? 52 : 0)}, ${i === 1 ? 85 : 44})`) //y轴最高点的位置,数值越高,越往下.call(yAxisGen);g.select('path').remove();// 移除轴线g.selectAll('line').remove(); // 移除刻度线g.selectAll('.tick text').attr('fill', defaultColorMap[i]).style('font-size', '12px').attr('text-anchor', 'end');const labelX = 20 + leftMarginBlank / 2;const labelY = 15; //y轴名称与顶部的距离svg.select(`.yAxisLabel${i}`).remove();const labelGroup = svg.append('text').attr('class', `yAxisLabel${i}`).attr('fill', defaultColorMap[i]).attr('x', labelX + (i * 45)).attr('y', labelY).attr('text-anchor', 'middle').attr('dominant-baseline', 'middle').style('font-size', '12px');// y轴名称 CVP是中心静脉压 ABP是动脉血压 HR是心率if (i === 0) {labelGroup.append('tspan').text('℃');} else if (i === 1) {labelGroup.append('tspan').attr('x', labelX + (i * 55) + 45) //调整y轴水平位置.attr('dy', 0).text('ABP');labelGroup.append('tspan').attr('x', labelX + (i * 55) + 45).attr('dy', '1em').text('mmHg');labelGroup.append('tspan').attr('x', labelX + (i * 55) + 45).attr('dy', '1.7em').text('HR');labelGroup.append('tspan').attr('x', labelX + (i * 55) + 45).attr('dy', '1em').text('bmp');} else if (i === 2) {labelGroup.append('tspan').attr('x', labelX + (i * 55) + 75).attr('dy', 0).text('CVP');labelGroup.append('tspan').attr('x', labelX + (i * 55) + 75).attr('dy', '1em').text('cmH2O');}});3.创建x轴
1.根据时间创建的x轴,后台返回的时间赋值给了this.timeRangeList,再进行优化处理格式
2.折线图背景是网格 20px一格,并且一格是5分钟,x轴一格是5分钟
// 单个网格宽度固定20px,宽度 = 20 * (时间点数 - 1)let signalGirdWidth = 20// 处理x轴时间数组let finerTimeRangeList = this.generate5MinTimeRange(this.timeRangeList);const xAxisTimes = finerTimeRangeList.map(d => new Date(d.stamp));let count = signalGirdWidth * (finerTimeRangeList.length - 1)const gridWidth = count //确定背景网格数
//分割时间 后台返回的时间是没有规则的,我需要把最早时间和最晚时间拿出来,并且分割成5分钟一个的规律时间,做x轴generate5MinTimeRange(originalTimeRange) {if (!originalTimeRange.length) return [];const startTime = new Date(originalTimeRange[0].timestr);const endTime = new Date(originalTimeRange[originalTimeRange.length - 1].timestr);const result = [];let currentTime = new Date(startTime);while (currentTime <= endTime) {const stamp = currentTime.getTime();//d3.timeFormat 格式化时间const timestr = d3.timeFormat("%Y-%m-%d %H:%M:%S")(currentTime);const time = d3.timeFormat("%H:%M")(currentTime);result.push({ timestr, time, stamp });// 增加5分钟currentTime = new Date(currentTime.getTime() + 5 * 60 * 1000);}return result;},
4.比例尺
// x轴比例尺const xScale = d3.scaleTime().domain(d3.extent(xAxisTimes)) //时间数组.range([0, gridWidth]);//映射宽度const interval = 5 * 60 * 1000;// 取最后一个时间点的时间戳const lastStamp = finerTimeRangeList[finerTimeRangeList.length - 1].stamp;// 追加3个时间点for (let i = 1; i <= 3; i++) {const newStamp = lastStamp + i * interval;const newDate = new Date(newStamp);finerTimeRangeList.push({timestr: d3.timeFormat("%Y-%m-%d %H:%M:%S")(newDate),time: d3.timeFormat("%H:%M")(newDate),stamp: newStamp});}let xAxisTimes1 = finerTimeRangeList.map(d => new Date(d.stamp)); //追加三个时间点// 绘制网格线 - 水平svg.append('g').attr('class', 'grid').attr('transform', `translate(${margin.left + yAxisWidth},0)`).selectAll('line.horizontal').data(d3.range(Math.floor(gridHeight / signalGirdWidth) + 2)).enter().append('line').attr('x1', 0).attr('x2', gridWidth + 60)//网格水平线宽度.attr('y1', d => d * signalGirdWidth).attr('y2', d => d * signalGirdWidth).attr('stroke', '#eee');// 绘制网格线 - 垂直svg.append('g').attr('class', 'grid').attr('transform', `translate(${margin.left + yAxisWidth},0)`).selectAll('line.vertical').data(xAxisTimes1) //网格垂直线的数量.enter().append('line').attr('y1', 0).attr('y2', gridHeight).attr('x1', d => xScale(d)).attr('x2', d => xScale(d)).attr('stroke', '#eee');5.完整代码
1.父组件
<chart :timeRangeList="timeRangeList" :chartList="isSelectChartList" :width="chartWidth"></chart>2.子组件
<template><div ref="chartContainer" class="chart-container"></div>
</template><script>
import * as d3 from 'd3';export default {name: 'MultiYAxisChart',props: {timeRangeList: {type: Array,required: true,// 格式示例:// [// { timestr: "2025-05-12 12:11:00", time: "12:11", stamp: 1747023060000 },// ...// ]},chartList: {type: Array,required: true,// 格式示例:// [// {// time: ["2025-05-12 12:20:00", ...],// name: "PULSE",// iconUrl: "●",// color: "#008000",// yAxisIndex: 1,// datalist: [65, ...]// },// ...// ]},},data() {return {allDataPoints:[],margin: { top: 40, right: 20, bottom: 30, left: 0 },yAxisWidth: 309,gridHeight: 480,tooltip: null};},watch: {timeRangeList: {handler() {this.drawChart();},deep: true,immediate: true},chartList: {handler(val) {this.drawChart();},deep: true,immediate: true}},methods: {// 分割时间generate5MinTimeRange(originalTimeRange) {if (!originalTimeRange.length) return [];const startTime = new Date(originalTimeRange[0].timestr);const endTime = new Date(originalTimeRange[originalTimeRange.length - 1].timestr);const result = [];let currentTime = new Date(startTime);while (currentTime <= endTime) {const stamp = currentTime.getTime();const timestr = d3.timeFormat("%Y-%m-%d %H:%M:%S")(currentTime);const time = d3.timeFormat("%H:%M")(currentTime);result.push({ timestr, time, stamp });// 增加5分钟currentTime = new Date(currentTime.getTime() + 5 * 60 * 1000);}return result;},transformData(chartList) {const parseTime = d3.timeParse("%Y-%m-%d %H:%M:%S");const result = [];chartList.forEach(line => {// console.log(line,'8888');line.time.forEach((timeStr, idx) => {result.push({x: parseTime(timeStr),y: line.datalist[idx],yAxisIndx: line.yAxisIndex,name: line.name,color: line.color,iconUrl: line.iconUrl,code:line.code,});});});return result;},drawChart() {if (!this.timeRangeList.length || !this.chartList.length) {d3.select(this.$refs.chartContainer).selectAll('svg').remove();return;}const margin = this.margin;const yAxisWidth = this.yAxisWidth;const gridHeight = this.gridHeight;// 转换折现数据this.allDataPoints = this.transformData(this.chartList)// 单个网格宽度固定19.7px,宽度 = 19.7 * (时间点数 - 1)let signalGirdWidth = 20// 处理x轴时间数组let finerTimeRangeList = this.generate5MinTimeRange(this.timeRangeList);const xAxisTimes = finerTimeRangeList.map(d => new Date(d.stamp));let count = signalGirdWidth * (finerTimeRangeList.length - 1)const gridWidth = count// console.log(gridWidth, '网格宽度!!!!!!!!!!');// 清空旧图d3.select(this.$refs.chartContainer).selectAll('svg').remove();// 宽度随时间点数变化,保证网格宽度16pxconst width = margin.left + yAxisWidth + gridWidth + margin.right + 40;const svg = d3.select(this.$refs.chartContainer).append('svg').attr('width', width).attr('height', gridHeight);// y轴相关参数const leftMarginBlank = 71;const rightMarginBlank = 40;const yAxisTotalWidth = yAxisWidth; // 278const yAxisUsableWidth = yAxisTotalWidth - leftMarginBlank - rightMarginBlank; // 167const yAxisWidths = [yAxisUsableWidth / 3,yAxisUsableWidth / 3,yAxisUsableWidth / 3];let yAxisXPositions = [];let accX = margin.left + leftMarginBlank;for (let w of yAxisWidths) {yAxisXPositions.push(accX);accX += w;}// y轴刻度范围(根据你的需求调整)const cvpTicks = d3.range(0, 22 + 1, 2);const abpTicks = d3.range(0, 200 + 1, 20)const tempTicks = d3.range(20, 42 + 1, 2);// y轴比例尺const yScales = [d3.scaleLinear().domain([20, 42]).range([gridHeight - 49, 0]),//y轴高度d3.scaleLinear().domain([0, 200]).range([gridHeight - 90, 0]), //通过修改y轴最高点和y轴比例尺 数据,更改y轴刻度线d3.scaleLinear().domain([0, 22]).range([gridHeight - 49, 0])];// console.log(xAxisTimes,'xAxisTimes');// x轴比例尺const xScale = d3.scaleTime().domain(d3.extent(xAxisTimes)) //时间数组.range([0, gridWidth]);//映射宽度const interval = 5 * 60 * 1000;// 取最后一个时间点的时间戳const lastStamp = finerTimeRangeList[finerTimeRangeList.length - 1].stamp;// 追加3个时间点for (let i = 1; i <= 3; i++) {const newStamp = lastStamp + i * interval;const newDate = new Date(newStamp);finerTimeRangeList.push({timestr: d3.timeFormat("%Y-%m-%d %H:%M:%S")(newDate),time: d3.timeFormat("%H:%M")(newDate),stamp: newStamp});}let xAxisTimes1 = finerTimeRangeList.map(d => new Date(d.stamp)); //追加三个时间点// 绘制网格线 - 水平svg.append('g').attr('class', 'grid').attr('transform', `translate(${margin.left + yAxisWidth},0)`).selectAll('line.horizontal').data(d3.range(Math.floor(gridHeight / signalGirdWidth) + 2)).enter().append('line').attr('x1', 0).attr('x2', gridWidth + 60)//网格水平线宽度.attr('y1', d => d * signalGirdWidth).attr('y2', d => d * signalGirdWidth).attr('stroke', '#eee');// 绘制网格线 - 垂直svg.append('g').attr('class', 'grid').attr('transform', `translate(${margin.left + yAxisWidth},0)`).selectAll('line.vertical').data(xAxisTimes1) //网格垂直线的数量.enter().append('line').attr('y1', 0).attr('y2', gridHeight).attr('x1', d => xScale(d)).attr('x2', d => xScale(d)).attr('stroke', '#eee');// y轴生成器const yAxisGenerators = [d3.axisLeft(yScales[0]).tickValues(tempTicks).tickSize(0).tickPadding(6).tickSizeOuter(0),d3.axisLeft(yScales[1]).tickValues(abpTicks).tickSize(0).tickPadding(6).tickSizeOuter(0),d3.axisLeft(yScales[2]).tickValues(cvpTicks).tickSize(0).tickPadding(6).tickSizeOuter(0)];// 默认颜色映射const defaultColorMap = {0: '#333333',1: '#333333',2: '#333333'};// 绘制y轴yAxisGenerators.forEach((yAxisGen, i) => {const g = svg.append('g').attr('class', 'axis').attr('transform', `translate(${yAxisXPositions[i] + (i === 1 ? 30 : i === 2 ? 52 : 0)}, ${i === 1 ? 85 : 44})`) //y轴最高点的位置,数值越高,越往下.call(yAxisGen);g.select('path').remove();// 移除轴线g.selectAll('line').remove(); // 移除刻度线g.selectAll('.tick text').attr('fill', defaultColorMap[i]).style('font-size', '12px').attr('text-anchor', 'end');const labelX = 20 + leftMarginBlank / 2;const labelY = 15; //y轴名称与顶部的距离svg.select(`.yAxisLabel${i}`).remove();const labelGroup = svg.append('text').attr('class', `yAxisLabel${i}`).attr('fill', defaultColorMap[i]).attr('x', labelX + (i * 45)).attr('y', labelY).attr('text-anchor', 'middle').attr('dominant-baseline', 'middle').style('font-size', '12px');// y轴名称 CVP是中心静脉压 ABP是动脉血压 HR是心率if (i === 0) {labelGroup.append('tspan').text('℃');} else if (i === 1) {labelGroup.append('tspan').attr('x', labelX + (i * 55) + 45) //调整y轴水平位置.attr('dy', 0).text('ABP');labelGroup.append('tspan').attr('x', labelX + (i * 55) + 45).attr('dy', '1em').text('mmHg');labelGroup.append('tspan').attr('x', labelX + (i * 55) + 45).attr('dy', '1.7em').text('HR');labelGroup.append('tspan').attr('x', labelX + (i * 55) + 45).attr('dy', '1em').text('bmp');} else if (i === 2) {labelGroup.append('tspan').attr('x', labelX + (i * 55) + 75).attr('dy', 0).text('CVP');labelGroup.append('tspan').attr('x', labelX + (i * 55) + 75).attr('dy', '1em').text('cmH2O');}});// x轴生成器const xAxis = d3.axisBottom(xScale).ticks(xAxisTimes.length).tickFormat(d3.timeFormat("%H:%M"));// 隐藏x轴// svg.append('g')// .attr('class', 'x-axis')// .attr('transform', `translate(${margin.left + yAxisWidth}, ${gridHeight - margin.bottom})`) // Position the x-axis// .call(xAxis);// 按name分组绘制折线const groupedData = d3.group(this.allDataPoints, d => d.code);// console.log(groupedData,'groupedData');groupedData.forEach((values, key) => {const color = values[0].color || '#333';const yAxisIndx = values[0].yAxisIndx;const yAxisIndexMap = {0: 2, // 数据中 CVP 对应比例尺索引 21: 1, // ABP 对应比例尺索引 12: 0 // ℃ 对应比例尺索引 0};const scaleIndex = yAxisIndexMap[yAxisIndx];const line = d3.line().x(d => xScale(d.x)).y(d => yScales[scaleIndex](d.y)).curve(d3.curveMonotoneX);// console.log(values,'zhangsanlizi');const translateY = scaleIndex === 1 ? 88 : (scaleIndex == 2 ? 46 : 52); //折线图点的位置,数值越大,折线图往下 0是温度svg.append('path').datum(values).attr('fill', 'none').attr('stroke', color).attr('stroke-width', 1).attr('transform', `translate(${margin.left + yAxisWidth},${translateY})`).attr('d', line);// 绘制点svg.append('g').attr('transform', `translate(${margin.left + yAxisWidth},${translateY})`).selectAll('text').data(values).enter().append('text').attr('x', d => xScale(d.x)).attr('y', d => yScales[scaleIndex](d.y)).attr('text-anchor', 'middle').attr('dominant-baseline', 'middle').style('font-family', 'YourIconFont, sans-serif') // 如果是图标字体,指定字体.style('font-size', '8px') //图标大小.style('font-weight', 'bold').text(d => d.iconUrl ?? '.') // 这里放接口返回的特殊字符// .attr('r', 4).attr('fill', d => d.color || color).on('mouseover', (event, d) => {const timeKey = d.x.getTime();const value = d.y;// 筛选时间和数值都相同的点const overlappingPoints = this.allDataPoints.filter(p => p.x.getTime() === timeKey && p.y === value);let htmlContent = `时间: ${d3.timeFormat("%Y-%m-%d %H:%M:%S")(d.x)}<br>数值: ${value}<br>`;overlappingPoints.forEach(p => {htmlContent += `编码:${p.code} 名称: ${p.name}<br>`;});this.tooltip.style('display', 'block') //.html(`名称: ${d.name}<br>时间: ${d3.timeFormat("%Y-%m-%d %H:%M:%S")(d.x)}<br>数值: ${d.y}<br>y轴: ${d.yAxisIndx}`) .html(htmlContent).style('left', (event.pageX + 10) + 'px').style('top', (event.pageY - (18 * overlappingPoints.length)) + 'px'); //提示图表,数值越大越往上}).on('mouseout', () => {this.tooltip.style('display', 'none');});});}},created() {this.tooltip = d3.select('body').append('div').attr('class', 'tooltip').style('position', 'absolute').style('background', 'rgba(0,0,0,0.7)').style('color', 'white').style('padding', '6px 8px').style('border-radius', '4px').style('pointer-events', 'none').style('font-size', '12px').style('display', 'none').style('z-index', 1000);},beforeDestroy() {if (this.tooltip) {this.tooltip.remove();}}
};
</script><style scoped>
.tooltip {position: absolute;pointer-events: none;font-size: 12px;background: rgba(0, 0, 0, 0.7);color: white;padding: 6px 8px;border-radius: 4px;display: none;z-index: 1000;white-space: nowrap;
}.chart-container {user-select: none;position: relative;height: 480px;margin-bottom: 10px;border-bottom: 1px solid #D9DCE1;
}.axis path {display: none;
}.axis line {display: none;
}.grid line {stroke: #ddd;stroke-opacity: 0.7;shape-rendering: crispEdges;
}.tooltip {position: absolute;pointer-events: none;font-size: 12px;background: rgba(0, 0, 0, 0.7);color: white;padding: 6px 8px;border-radius: 4px;display: none;
}
</style>