HTML5+JS实现一个简单的SVG 贝塞尔曲线可视化设计器,通过几个点移动位置,控制曲线的方向
三次贝塞尔曲线,二次贝塞尔曲线有什么区别
https://blog.csdn.net/xiaoyao961/article/details/148678265
SVG 贝塞尔曲线可视化设计器
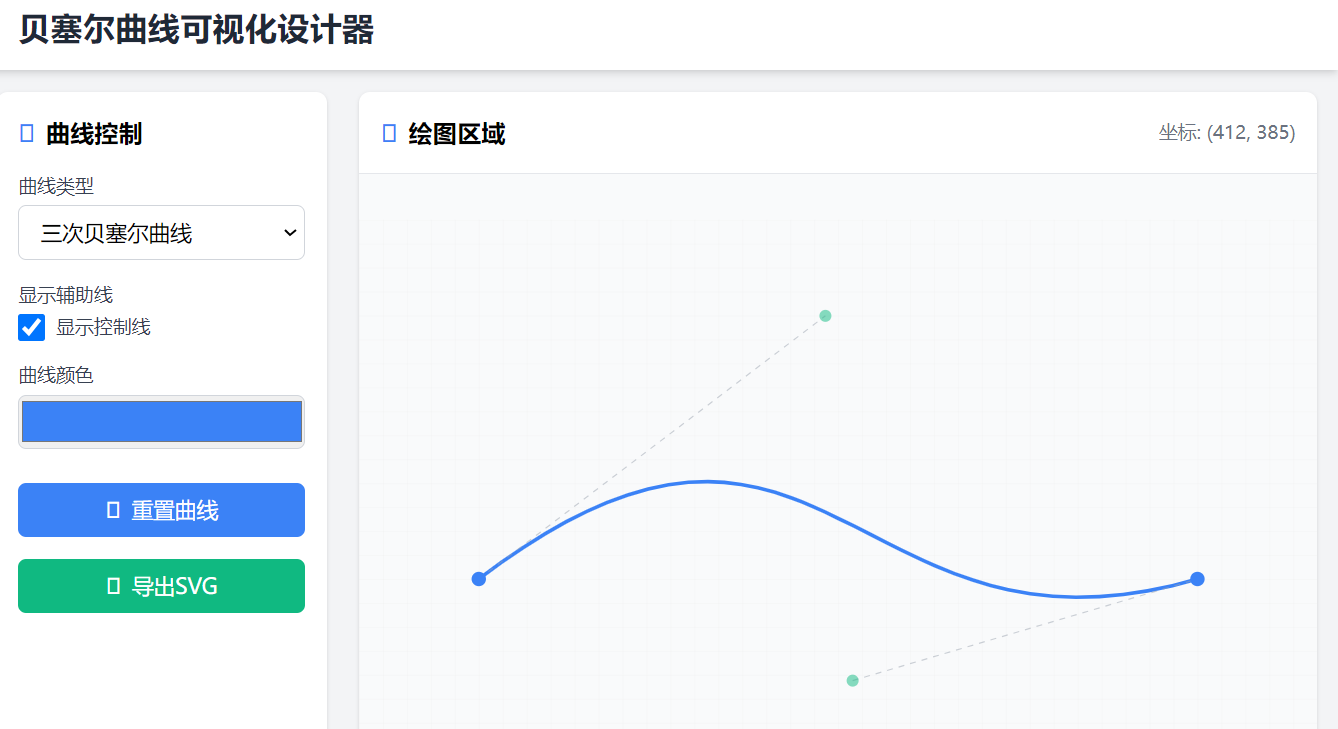
下面是一个简单的贝塞尔曲线可视化设计器,使用 HTML5 和 JavaScript 实现。这个设计器允许你通过拖动控制点来实时调整贝塞尔曲线的形状。
这个贝塞尔曲线设计器具有以下特点:
直观的交互:可以直接拖动起点、终点和控制点来调整曲线形状
曲线类型切换:支持二次贝塞尔曲线和三次贝塞尔曲线
辅助线显示:可以显示或隐藏控制点之间的连接线,帮助理解曲线形成原理
颜色自定义:可以更改曲线的颜色
导出功能:可以将当前曲线导出为 SVG 文件
坐标显示:实时显示鼠标位置和控制点坐标
响应式设计:适配不同屏幕尺寸
您可以通过拖动各个点来观察曲线的变化,直观地理解贝塞尔曲线的形成原理。这对于网页设计、动画制作和游戏开发等领域都非常有用。
<script src="https://cdn.tailwindcss.com"></script>3.4.16.js
<link href="https://cdn.jsdelivr.net/npm/font-awesome@4.7.0/css/font-awesome.min.css" rel="stylesheet">
<!DOCTYPE html>
<html lang="zh-CN">
<head><meta charset="UTF-8"><meta name="viewport" content="width=device-width, initial-scale=1.0"><title>贝塞尔曲线可视化设计器</title><script src="3.4.16.js"></script><link href="font-awesome.min.css" rel="stylesheet"><script>tailwind.config = {theme: {extend: {colors: {primary: '#3B82F6',secondary: '#10B981',accent: '#F59E0B',dark: '#1F2937',},fontFamily: {inter: ['Inter', 'sans-serif'],},}}}</script><style type="text/tailwindcss">@layer utilities {.content-auto {content-visibility: auto;}.bezier-control {cursor: move;transition: r 0.2s, fill 0.2s;}.bezier-control:hover {r: 8;fill: #F59E0B;}.bezier-handle {cursor: move;opacity: 0.5;transition: r 0.2s, fill 0.2s;}.bezier-handle:hover {r: 6;fill: #F59E0B;}.bezier-path {fill: none;stroke-width: 3;stroke-linecap: round;stroke-linejoin: round;}.bezier-guide {stroke-dasharray: 5,5;stroke-width: 1;stroke-opacity: 0.5;}}</style>
</head>
<body class="bg-gray-100 font-inter min-h-screen flex flex-col"><header class="bg-white shadow-md py-4 px-6"><div class="container mx-auto"><h1 class="text-2xl font-bold text-dark flex items-center"><i class="fa fa-curve mr-2 text-primary"></i>贝塞尔曲线可视化设计器</h1></div></header><main class="flex-1 container mx-auto p-4 flex flex-col md:flex-row gap-6"><!-- 控制面板 --><div class="md:w-1/4 bg-white rounded-lg shadow p-4"><h2 class="text-lg font-semibold mb-4 flex items-center"><i class="fa fa-sliders text-primary mr-2"></i>曲线控制</h2><div class="mb-4"><label class="block text-sm font-medium text-gray-700 mb-1">曲线类型</label><select id="curveType" class="w-full px-3 py-2 border border-gray-300 rounded-md focus:outline-none focus:ring-2 focus:ring-primary/50"><option value="cubic">三次贝塞尔曲线</option><option value="quadratic">二次贝塞尔曲线</option></select></div><div id="cubicControls" class="mb-4"><label class="block text-sm font-medium text-gray-700 mb-1">显示辅助线</label><div class="flex items-center space-x-4"><label class="inline-flex items-center"><input type="checkbox" id="showGuides" class="form-checkbox h-5 w-5 text-primary rounded" checked><span class="ml-2 text-sm text-gray-700">显示控制线</span></label></div></div><div class="mb-4"><label class="block text-sm font-medium text-gray-700 mb-1">曲线颜色</label><input type="color" id="curveColor" class="w-full h-10 border border-gray-300 rounded-md" value="#3B82F6"></div><div class="mt-6"><button id="resetBtn" class="w-full bg-primary hover:bg-primary/90 text-white font-medium py-2 px-4 rounded-md transition duration-200 flex items-center justify-center"><i class="fa fa-refresh mr-2"></i>重置曲线</button></div><div class="mt-4"><button id="exportBtn" class="w-full bg-secondary hover:bg-secondary/90 text-white font-medium py-2 px-4 rounded-md transition duration-200 flex items-center justify-center"><i class="fa fa-download mr-2"></i>导出SVG</button></div></div><!-- 绘图区域 --><div class="md:w-3/4 flex-1 bg-white rounded-lg shadow overflow-hidden"><div class="p-4 border-b border-gray-200 flex justify-between items-center"><h2 class="text-lg font-semibold flex items-center"><i class="fa fa-paint-brush text-primary mr-2"></i>绘图区域</h2><div class="text-sm text-gray-500"><span id="coordinateDisplay">坐标: -</span></div></div><div class="relative"><!-- SVG 绘图区域 --><svg id="bezierCanvas" class="w-full h-[600px] bg-gray-50" viewBox="0 0 800 600"><!-- 网格背景 --><pattern id="grid" width="20" height="20" patternUnits="userSpaceOnUse"><path d="M 20 0 L 0 0 0 20" fill="none" stroke="#eee" stroke-width="0.5"/></pattern><rect width="100%" height="100%" fill="url(#grid)"/><!-- 贝塞尔曲线 --><path id="bezierPath" class="bezier-path" stroke="#3B82F6" d=""/><!-- 控制线(辅助线) --><line id="controlLine1" class="bezier-guide" stroke="#9CA3AF" x1="0" y1="0" x2="0" y2="0" /><line id="controlLine2" class="bezier-guide" stroke="#9CA3AF" x1="0" y1="0" x2="0" y2="0" /><!-- 控制点 --><circle id="startPoint" class="bezier-control" cx="100" cy="300" r="6" fill="#3B82F6" /><circle id="endPoint" class="bezier-control" cx="700" cy="300" r="6" fill="#3B82F6" /><!-- 二次贝塞尔曲线控制点 --><circle id="controlPoint1" class="bezier-handle" cx="400" cy="150" r="5" fill="#10B981" /><!-- 三次贝塞尔曲线控制点(默认隐藏) --><circle id="controlPoint2" class="bezier-handle" cx="400" cy="450" r="5" fill="#10B981"></circle></svg></div></div></main><footer class="bg-dark text-white py-4 mt-6"><div class="container mx-auto px-4 text-center text-sm"><p>贝塞尔曲线可视化设计器 © 2025</p></div></footer><script>// 初始化变量let isDragging = false;let selectedElement = null;let offset = { x: 0, y: 0 };let curveType = 'cubic';let showGuides = true;// 获取DOM元素const svg = document.getElementById('bezierCanvas');const bezierPath = document.getElementById('bezierPath');const startPoint = document.getElementById('startPoint');const endPoint = document.getElementById('endPoint');const controlPoint1 = document.getElementById('controlPoint1');const controlPoint2 = document.getElementById('controlPoint2');const controlLine1 = document.getElementById('controlLine1');const controlLine2 = document.getElementById('controlLine2');const curveTypeSelect = document.getElementById('curveType');const showGuidesCheckbox = document.getElementById('showGuides');const curveColorInput = document.getElementById('curveColor');const resetBtn = document.getElementById('resetBtn');const exportBtn = document.getElementById('exportBtn');const coordinateDisplay = document.getElementById('coordinateDisplay');// 更新贝塞尔曲线function updateBezierCurve() {const startX = parseFloat(startPoint.getAttribute('cx'));const startY = parseFloat(startPoint.getAttribute('cy'));const endX = parseFloat(endPoint.getAttribute('cx'));const endY = parseFloat(endPoint.getAttribute('cy'));const cp1X = parseFloat(controlPoint1.getAttribute('cx'));const cp1Y = parseFloat(controlPoint1.getAttribute('cy'));const cp2X = parseFloat(controlPoint2.getAttribute('cx'));const cp2Y = parseFloat(controlPoint2.getAttribute('cy'));// 更新控制线if (showGuides) {controlLine1.setAttribute('x1', startX);controlLine1.setAttribute('y1', startY);controlLine1.setAttribute('x2', cp1X);controlLine1.setAttribute('y2', cp1Y);if (curveType === 'cubic') {controlLine2.setAttribute('x1', cp2X);controlLine2.setAttribute('y1', cp2Y);controlLine2.setAttribute('x2', endX);controlLine2.setAttribute('y2', endY);}}// 更新曲线let pathData = '';if (curveType === 'quadratic') {pathData = `M ${startX},${startY} Q ${cp1X},${cp1Y} ${endX},${endY}`;} else {pathData = `M ${startX},${startY} C ${cp1X},${cp1Y} ${cp2X},${cp2Y} ${endX},${endY}`;}bezierPath.setAttribute('d', pathData);}// 处理SVG坐标function getSVGPoint(event) {const pt = svg.createSVGPoint();pt.x = event.clientX;pt.y = event.clientY;return pt.matrixTransform(svg.getScreenCTM().inverse());}// 事件处理:开始拖动function startDrag(event) {if (event.target.classList.contains('bezier-control') || event.target.classList.contains('bezier-handle')) {isDragging = true;selectedElement = event.target;const svgPoint = getSVGPoint(event);const cx = parseFloat(selectedElement.getAttribute('cx'));const cy = parseFloat(selectedElement.getAttribute('cy'));offset.x = svgPoint.x - cx;offset.y = svgPoint.y - cy;svg.style.cursor = 'grabbing';event.preventDefault();}}// 事件处理:拖动中function drag(event) {if (isDragging) {const svgPoint = getSVGPoint(event);const cx = svgPoint.x - offset.x;const cy = svgPoint.y - offset.y;// 限制在SVG画布内const svgRect = svg.getBoundingClientRect();const newX = Math.max(0, Math.min(cx, svgRect.width));const newY = Math.max(0, Math.min(cy, svgRect.height));selectedElement.setAttribute('cx', newX);selectedElement.setAttribute('cy', newY);// 更新坐标显示coordinateDisplay.textContent = `坐标: (${Math.round(newX)}, ${Math.round(newY)})`;// 更新曲线updateBezierCurve();}}// 事件处理:结束拖动function endDrag() {isDragging = false;selectedElement = null;svg.style.cursor = 'default';}// 事件处理:曲线类型变更function handleCurveTypeChange() {curveType = curveTypeSelect.value;if (curveType === 'quadratic') {controlPoint2.style.display = 'none';controlLine2.style.display = 'none';} else {controlPoint2.style.display = 'block';controlLine2.style.display = 'block';}updateBezierCurve();}// 事件处理:显示辅助线变更function handleShowGuidesChange() {showGuides = showGuidesCheckbox.checked;controlLine1.style.display = showGuides ? 'block' : 'none';controlLine2.style.display = showGuides && curveType === 'cubic' ? 'block' : 'none';}// 事件处理:曲线颜色变更function handleCurveColorChange() {bezierPath.setAttribute('stroke', curveColorInput.value);startPoint.setAttribute('fill', curveColorInput.value);endPoint.setAttribute('fill', curveColorInput.value);}// 事件处理:重置按钮function handleReset() {// 重置点位置startPoint.setAttribute('cx', 100);startPoint.setAttribute('cy', 300);endPoint.setAttribute('cx', 700);endPoint.setAttribute('cy', 300);controlPoint1.setAttribute('cx', 400);controlPoint1.setAttribute('cy', 150);controlPoint2.setAttribute('cx', 400);controlPoint2.setAttribute('cy', 450);// 重置曲线类型和颜色curveTypeSelect.value = 'quadratic';curveType = 'quadratic';curveColorInput.value = '#3B82F6';bezierPath.setAttribute('stroke', '#3B82F6');startPoint.setAttribute('fill', '#3B82F6');endPoint.setAttribute('fill', '#3B82F6');// 更新显示controlPoint2.style.display = 'none';controlLine2.style.display = 'none';showGuidesCheckbox.checked = true;showGuides = true;// 更新曲线updateBezierCurve();}// 事件处理:导出SVGfunction handleExport() {// 创建新的SVG元素const exportSvg = svg.cloneNode(true);// 移除事件监听器和不必要的元素exportSvg.removeAttribute('style');exportSvg.removeAttribute('onmousedown');exportSvg.removeAttribute('onmousemove');exportSvg.removeAttribute('onmouseup');// 移除网格背景的pattern引用const rect = exportSvg.querySelector('rect');if (rect) {rect.setAttribute('fill', 'white');}// 移除坐标显示相关元素const coordinateDisplay = exportSvg.querySelector('#coordinateDisplay');if (coordinateDisplay) {coordinateDisplay.parentNode.removeChild(coordinateDisplay);}// 创建SVG字符串const svgData = new XMLSerializer().serializeToString(exportSvg);// 创建下载链接const blob = new Blob([svgData], {type: 'image/svg+xml'});const url = URL.createObjectURL(blob);const a = document.createElement('a');a.href = url;a.download = 'bezier-curve.svg';document.body.appendChild(a);a.click();setTimeout(() => {document.body.removeChild(a);URL.revokeObjectURL(url);}, 0);}// 添加事件监听器svg.addEventListener('mousedown', startDrag);document.addEventListener('mousemove', drag);document.addEventListener('mouseup', endDrag);curveTypeSelect.addEventListener('change', handleCurveTypeChange);showGuidesCheckbox.addEventListener('change', handleShowGuidesChange);curveColorInput.addEventListener('input', handleCurveColorChange);resetBtn.addEventListener('click', handleReset);exportBtn.addEventListener('click', handleExport);// 初始化updateBezierCurve();handleShowGuidesChange();</script>
</body>
</html>