MSTNet:用于糖尿病视网膜病变分类的多尺度空间感知 Transformer 与多实例学习方法|文献速递-深度学习医疗AI最新文献
Title
题目
MSTNet: Multi-scale spatial-aware transformer with multi-instance learning for diabetic retinopathy classification
MSTNet:用于糖尿病视网膜病变分类的多尺度空间感知 Transformer 与多实例学习方法
01
文献速递介绍
糖尿病视网膜病变(DR)是糖尿病的主要并发症之一,影响全球数百万人,严重威胁视力健康并可能导致成人失明(Heald等人,2020;Teo等人,2021)。约三分之一的糖尿病患者受DR影响,且这一数字呈上升趋势。DR的早期检测和及时治疗对预防视力丧失至关重要,但其早期症状通常不明显,诊断需要先进医疗设备和专业知识,导致许多患者确诊时已处于晚期。因此,开发高效精准的DR早期诊断与分级方法是医学影像领域的重大挑战。 医学影像技术的发展使眼底摄影成为DR诊断的核心手段。在医学领域,DR分级通常分为五个严重程度级别(如图1所示):正常、轻度、中度、重度和增殖性。随着DR进展,各种病理特征之间存在复杂的相互作用和综合影响。例如,微动脉瘤是毛细血管壁损伤的标志,其破裂和渗漏会导致血视网膜屏障功能障碍,进而引起视网膜水肿和液体渗出(Liu,2022)。微动脉瘤破裂导致视网膜内出血,血液中的脂质和蛋白质渗漏形成硬性渗出物,加剧视网膜损伤(Zhao等人,2017;Han等人,2015)。这些病理变化相互作用,共同增加DR的严重程度,尤其是在黄斑区,最终导致视力损害加重(Wang等人,2009;Yan等人,2011)。因此,这些病理特征之间的动态关系对DR的诊断和治疗至关重要,但这一过程耗时且需要大量专业知识。 通过计算机辅助诊断技术实现DR分级和诊断的自动化已成为研究热点(Li等人,2022;Wang等人,2021b)。深度学习,尤其是卷积神经网络(CNN),在医学图像分析中取得了显著进展,能够从大量标记图像中自主学习,在DR分级和诊断中达到甚至超过人类专家的准确性(Li等人,2019b)。例如,Liu等人(2019)提出WP-CNN,通过多加权路径集成学习增强CNN,提高可参考DR的检测精度;Gayathri等人(2020)设计了专门的CNN模型提取视网膜图像关键特征,提升DR自动检测与分类能力;Hemalakshmi等人(2021)引入CNN-RBF框架,通过预处理、特征提取和CNN与径向基函数(RBF)模型融合,显著提高视网膜疾病分类精度。 然而,现有CNN在处理复杂的空间相互作用和长距离依赖时存在不足,尤其在眼底图像中病变分散的细微检查中更为明显,可能影响DR类型和严重程度诊断的准确性。CNN可能无法充分识别不同病变区域之间的相关性和全局性,而这对准确评估DR至关重要。 视觉Transformer(ViT)(Dosovitskiy等人,2020)源于自然语言处理中的Transformer架构,能够捕捉长程依赖和全局信息,在需要整体理解的复杂医学图像分析中具有优势。例如,Wu等人(2021a)利用ViT识别DR不同阶段,证明了纯注意力机制在医学影像分析中的有效性;Bi等人(2023)提出MIL-ViT框架,融合ViT的全局语义分析能力和多实例学习(MIL)的局部特征提取能力,解决视网膜疾病分类难题;Yang等人(2024)提出TMIL,将多实例学习引入Transformer模型,避免高分辨率视网膜成像中的信息丢失,为DR分类设定新基准。 尽管Transformer架构在医学图像分析中具有优势,但其存在局限性:首先,Transformer缺乏CNN固有的空间局部归纳和先验知识,需要更大数据集才能有效学习,这在医学影像领域(样本采集成本高、耗时长)构成重大障碍;其次,与自然图像中主体通常占据大而连续的像素区域不同,医学图像中的病变多为微小且可能间隔分布,ViT依赖单一分类头进行分类任务可能不足(Yu等人,2021),可能忽略细微特征和相关信息;此外,CNN和Transformer使用单尺度信息特征可能导致不同观察维度的信息丢失,这也与人类感知和识别方式不符。 为解决这些问题,我们提出一种用于DR分类的新型多尺度空间感知Transformer网络(MSTNet)。该模型通过编码不同尺度的图像块并整合空间局部信息,构建双路径架构: 1. 空间感知模块(SAM):在输入阶段引入SAM,分为空间特征提取器和特征注入器。提取器采用ResNet主干的标准卷积结构(He等人,2016)提取三种不同分辨率的特征,构建空间特征库;注入器利用交叉注意力机制将空间局部信息从特征库嵌入模型的双路径特征序列,缓解Transformer架构缺乏空间局部信息的固有缺陷。 2. 多尺度编码器(MSE):为增强双路径之间的特征信息交互,每条路径使用预定义的分类标记(CLS token)作为MSE内的交换媒介,通过CLS交互注意力(CIA)实现跨路径全局信息的有效交换与融合。 3. 多实例学习(MIL):为更精准捕捉细微关键病变区域,不仅依赖最终CLS标记分类,还引入MIL方法,通过门控注意力机制聚合层内和层间的每个特征实例,形成综合包表示,最终与双路径的CLS标记交叉级联,合成用于分类的最终特征向量。 在四个公共数据集上的实验和可视化分析表明,MSTNet优于现有先进方法。主要贡献如下: • 提出新型多尺度空间感知Transformer网络(MSTNet),利用双路径架构和交互注意力机制显著增强眼底图像的特征表示与分析能力。 • 设计空间感知模块挖掘图像内的结构先验知识,有效缓解Transformer架构缺乏空间局部信息的局限性,减少模型对大规模训练数据集的依赖,提升泛化能力。 • 引入多实例学习(MIL)增强模型对视网膜图像关键病变区域的敏感性,确保对图像关键细节的评估更准确可靠。
Abatract
摘要
Diabetic retinopathy (DR), the leading cause of vision loss among diabetic adults worldwide, underscores the importance of early detection and timely treatment using fundus images to prevent vision loss. However, existing deep learning methods struggle to capture the correlation and contextual information of subtle lesion features with the current scale of dataset. To this end, we propose a novel Multi-scale Spatial-aware Transformer Network (MSTNet) for DR classification. MSTNet encodes information from image patches at varying scales as input features, constructing a dual-pathway backbone network comprised of two Transformer encoders of different sizes to extract both local details and global context from images. To fully leverage structural prior knowledge, we introduce a Spatial-aware Module (SAM) to capture spatial local information within the images. Furthermore, considering the differences between medical and natural images, specifically that regions of interest in medical images often lack distinct subjectivity and continuity, we employ a Multiple Instance Learning (MIL) strategy to aggregate features from diverse regions, thereby enhancing correlation to subtle lesion areas. Ultimately, a cross-fusion classifier integrates dual-pathway features to produce the final classification result. We evaluate MSTNet on four public DR datasets, including APTOS2019, RFMiD2020, Messidor, and IDRiD. Extensive experiments demonstrate that MSTNet exhibits superior diagnostic and grading accuracy, achieving improvements of up to 2.0% in terms of ACC and 1.2% in terms of F1 score, highlighting its effectiveness in accurately assessing fundus images.
糖尿病视网膜病变(DR)是全球糖尿病成年人视力丧失的主要原因,这凸显了利用眼底图像进行早期检测和及时治疗以预防视力丧失的重要性。然而,现有深度学习方法在当前数据集规模下难以捕捉细微病变特征的相关性和上下文信息。为此,我们提出了一种用于DR分类的新型多尺度空间感知Transformer网络(MSTNet)。MSTNet将不同尺度的图像补丁信息编码为输入特征,构建了由两个不同尺寸的Transformer编码器组成的双路径主干网络,以提取图像中的局部细节和全局上下文。为了充分利用结构先验知识,我们引入了空间感知模块(SAM)来捕捉图像内的空间局部信息。此外,考虑到医学图像与自然图像的差异,特别是医学图像中的感兴趣区域往往缺乏明显的主观性和连续性,我们采用多实例学习(MIL)策略来聚合不同区域的特征,从而增强与细微病变区域的相关性。最终,通过交叉融合分类器整合双路径特征以生成最终分类结果。我们在四个公共DR数据集(包括APTOS2019、RFMiD2020、Messidor和IDRiD)上对MSTNet进行了评估。大量实验表明,MSTNet表现出卓越的诊断和分级准确性,ACC提高了2.0%,F1分数提高了1.2%,突出了其在准确评估眼底图像方面的有效性。
Method
方法
This section details the methodologies employed in our study. It is structured around three pivotal components: the spatial-aware module, the multi-scale encoder, and the cross-fusion classifier. Each of these components plays a critical role in our model’s ability to effectively process and analyze complex retinal images.
本节详细介绍了本研究中使用的方法。它围绕三个关键组件展开:空间感知模块、多尺度编码器和交叉融合分类器。这些组件中的每一个都在我们的模型有效处理和分析复杂视网膜图像的能力中发挥着关键作用。
Conclusion
结论
This study explores the classification of DR from fundus images by introducing the MSTNet, which is designed for precise DR grading and diagnosis. To enhance the model’s performance on small-scale datasets without altering its original structure, we infused the spatial local information into both scale pathways of the model through SAM, compensating for the inherent lack of prior knowledge due to architectural constraints. Additionally, to more accurately capture subtle and critical lesion areas, we employed a gated attention-based MIL strategy, which aggregates different lesion regions and enriches the final feature representation to make it more comprehensive. Extensive experiments across multiple public datasets, including APTOS2019, RFMiD2020, Messidor, and IDRiD, demonstrated our model’s effectiveness in DR detection and grading tasks, achieving improvements of up to 2.0% in terms of ACC and 1.2% in terms of F1 score, highlighting its exceptional capability
本研究通过引入MSTNet模型探索了基于眼底图像的糖尿病视网膜病变(DR)分类方法,该模型旨在实现精准的DR分级与诊断。为了在不改变模型原有结构的前提下提升其在小规模数据集上的性能,我们通过空间感知模块(SAM)将空间局部信息注入模型的双尺度路径,弥补了因架构限制导致的先验知识固有缺失。此外,为了更准确地捕捉细微但关键的病变区域,我们采用了基于门控注意力的多实例学习(MIL)策略,该策略通过聚合不同病变区域来丰富最终的特征表示,使其更具全面性。在APTOS2019、RFMiD2020、Messidor和IDRiD等多个公开数据集上的大量实验表明,我们的模型在DR检测和分级任务中表现出色,准确率(ACC)提升幅度最高达2.0%,F1分数提升1.2%,凸显了其卓越的性能。
Results
结果
For our investigation, we utilized four publicly accessible datasets associated with DR: APTOS 2019, RFMiD2020, Messidor, and IDRiD, serving as our foundational data. To ensure the robustness of our study and maintain consistency in data processing, we allocated each dataset into training, validation, and testing subsets following an 8:1:1 distribution ratio. APTOS2019 (APTOS 2019 blindness detection, 2019): The APTOS 2019 blindness detection challenge was initiated by the Asia Pacific Tele-Ophthalmology Society (APTOS) in 2019 with the goal of leveraging fundus photography for the identification and severity assessment of DR. The collection includes 3662 fundus photographs, which are categorized into different stages of DR, ranging from no DR (grade 0) to proliferative DR (grade 4). RFMiD2020 (Retinal Image Analysis for Multi-Disease Detection Challenge, 2020): The Retinal Fundus Multi-disease Image Dataset (RFMiD) was specifically created for the 2020 challenge in automated detection of retinal diseases. It includes 1900 fundus images, each annotated with one or more of 45 distinct retinal conditions. Ourstudy predominantly focuses on leveraging the DR-related annotations present within this dataset. Messidor (Messidor Dataset, 2004): The Messidor dataset, contributed by several French hospitals, encompasses over 1200 fundus photographs captured through a range of digital fundus cameras. Each photograph is meticulously annotated to indicate the presence and severity level of DR, organized into five distinct stages. IDRiD (Indian Diabetic Retinopathy Image Dataset (IDRiD), 2018): The Indian Diabetic Retinopathy Image Dataset (IDRiD) stands as the first dataset specifically released for the detailed analysis and classification of diabetic retinopathy and associated conditions. Comprising 516 high-quality fundus photographs, this dataset offers detailed visual data. With a modest dataset size, our research utilizes a binary classification approach, differentiating between the absence and presence of DR.
在本研究中,我们采用了四个与糖尿病视网膜病变(DR)相关的公开数据集作为基础数据:APTOS 2019、RFMiD2020、Messidor和IDRiD。为确保研究的稳健性和数据处理的一致性,我们将每个数据集按8:1:1的比例划分为训练集、验证集和测试集。具体数据集介绍如下: 1. APTOS2019(APTOS 2019致盲性检测数据集,2019) APTOS 2019致盲性检测挑战赛由亚太远程眼科学会(APTOS)于2019年发起,旨在利用眼底摄影技术识别DR并评估其严重程度。该数据集包含3662张眼底照片,覆盖从无DR(0级)到增殖性DR(4级)的不同阶段。 2. RFMiD2020(视网膜图像多疾病检测挑战赛数据集,2020) 视网膜眼底多疾病图像数据集(RFMiD)专为2020年视网膜疾病自动检测挑战赛设计,包含1900张眼底图像,每张图像标注了45种不同视网膜疾病中的一种或多种。本研究主要利用该数据集中与DR相关的标注信息。 3. Messidor(Messidor数据集,2004) Messidor数据集由多家法国医院提供,包含1200余张通过不同数码眼底相机拍摄的眼底照片。每张照片均经过细致标注,标明DR的存在及严重程度,分为五个不同阶段。 4. IDRiD(印度糖尿病视网膜病变图像数据集,2018) 印度糖尿病视网膜病变图像数据集(IDRiD)是首个专门用于DR及其相关病症详细分析和分类的数据集,包含516张高质量眼底照片,提供了详细的视觉数据。由于该数据集规模较小,本研究采用二分类方法,区分无DR和有DR状态。
Figure
图
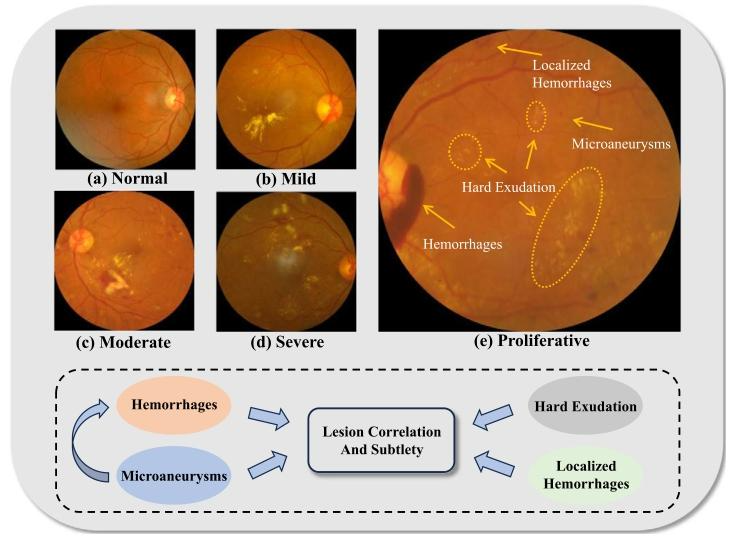
Fig. 1. Analysis of DR severity progression from Normal to Proliferative and lesion correlation on the APTOS2019 dataset.
图1. APTOS2019数据集上从正常到增殖性糖尿病视网膜病变(DR)严重程度进展及病变相关性分析。
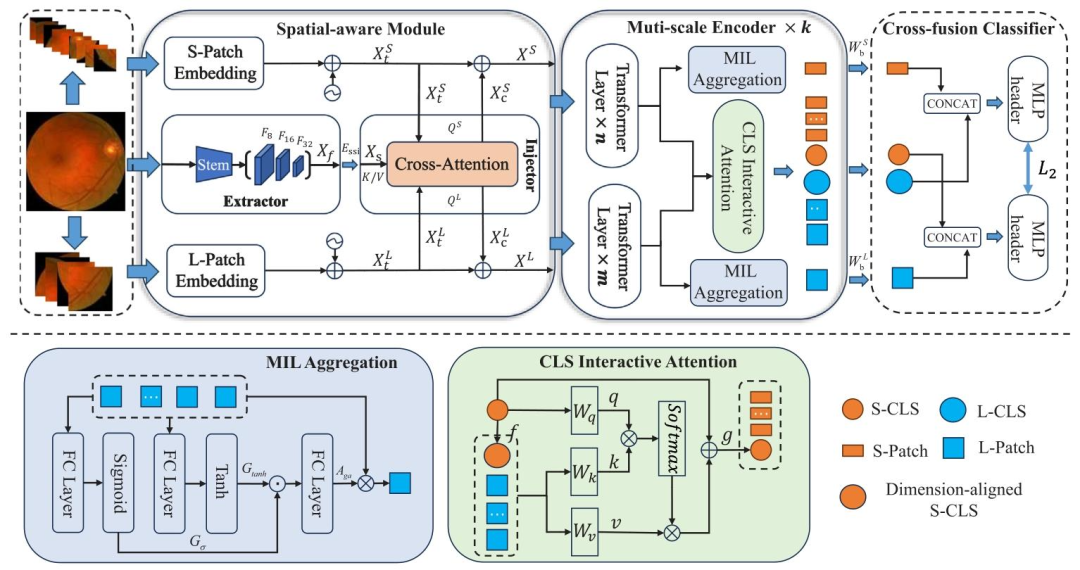
Fig. 2. The overall architecture of the proposed method. It is mainly composed of three parts: spatial-aware module, multi-scale encoder and cross-fusion classifier. In the spatial-aware module, spatial features at different scales are extracted through an extractor to form a feature bank ???? . Then, ???? information is injected into the dual-pathway feature ???? by an injector. In the multi-scale encoder, the feature sequences ???? of different pathways pass through the corresponding Transformer layer, and then the output is aggregated by MIL aggregation applied to the sequence ?? ?? ??,???????? ℎ , resulting in ?? ?? ??,?? . After stacking ?? encoders, each layer’s ?? ?? ??,?? is aggregated into ?? ?? ?? via ?? ?? ?? . Subsequently, the output feature ?? ?? ??,?? ?? ?? is cross-concatenated with ?? ?? ?? from an alternate pathway. Final classification is executed by the harmonized outputs of two classification heads
图2. 所提方法的整体架构。其主要由三部分组成:空间感知模块、多尺度编码器和交叉融合分类器。在空间感知模块中,通过特征提取器提取不同尺度的空间特征以形成特征库????,然后通过注入器将????中的信息注入双路径特征????。在多尺度编码器中,不同路径的特征序列????通过相应的Transformer层,随后对序列?? ?? ??,???????? ℎ 应用多实例学习(MIL)聚合以输出?? ?? ??,??。堆叠??个编码器后,每层的?? ?? ??,??通过?? ?? ??聚合为?? ?? ??。随后,将输出特征?? ?? ??,?? ?? ??与来自另一路径的?? ?? ??进行交叉级联。最终通过两个分类头的协调输出执行分类。
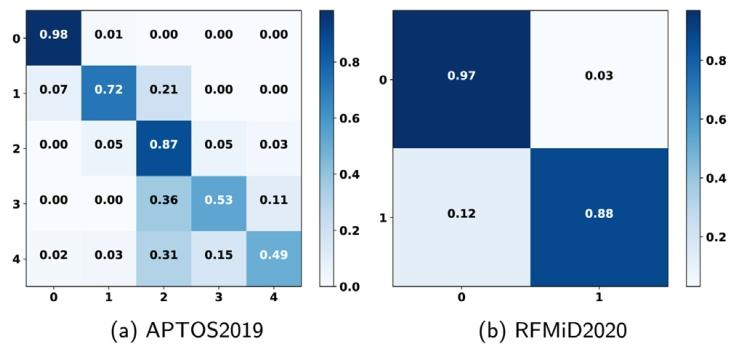
Fig. 3. The confusion matrix of the classification results from APTOS2019 and RFMiD2020 datasets.
图3. APTOS2019和RFMiD2020数据集分类结果的混淆矩阵
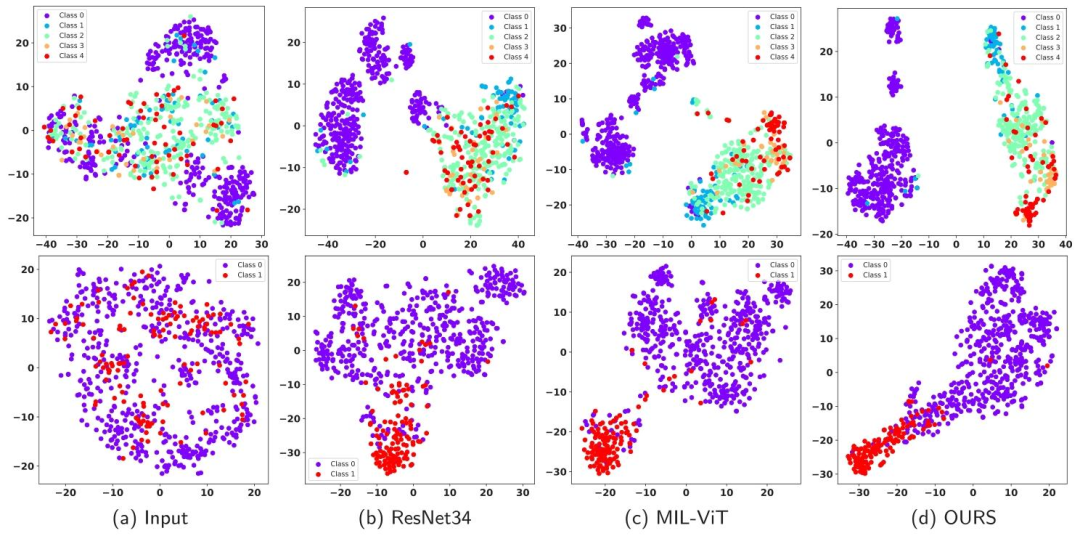
Fig. 4. Classification visualization on the APTOS2019 (the first Line) and RFMiD2020 (the second line) datasets. The results as shown are the direct input, the output of ResNet34, MIL-ViT and proposed model from left to right.
图4. APTOS2019数据集(第一行)和RFMiD2020数据集(第二行)的分类可视化结果。从左到右依次为直接输入图像、ResNet34输出、MIL-ViT输出和所提模型输出。
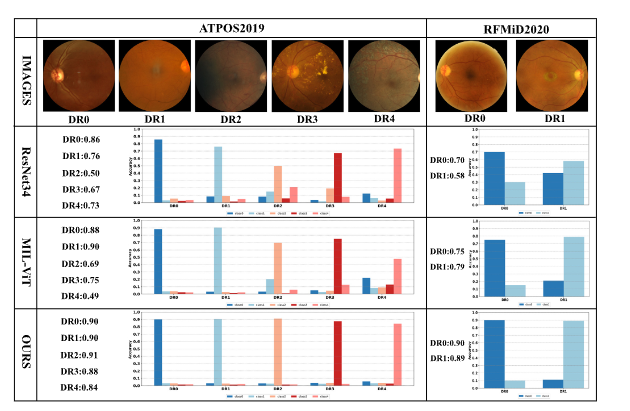
Fig. 5. Comparative classification results of different models for each category on the APTOS2019 and RFMiD2020 datasets. DR0-DR4 labels on the left side of the figure represent the predictions of the correct category
图5. 不同模型在APTOS2019和RFMiD2020数据集上各类别分类结果对比。图左侧DR0-DR4标签表示正确类别的预测结果。
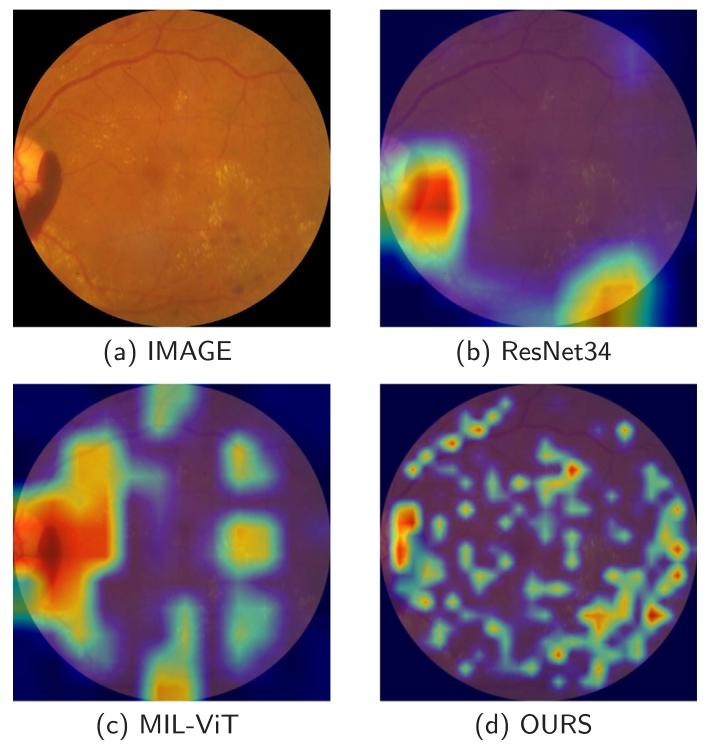
Fig. 6. Comparison of attention maps across different models for retinal lesion localization.
图6. 不同模型用于视网膜病变定位的注意力图对比
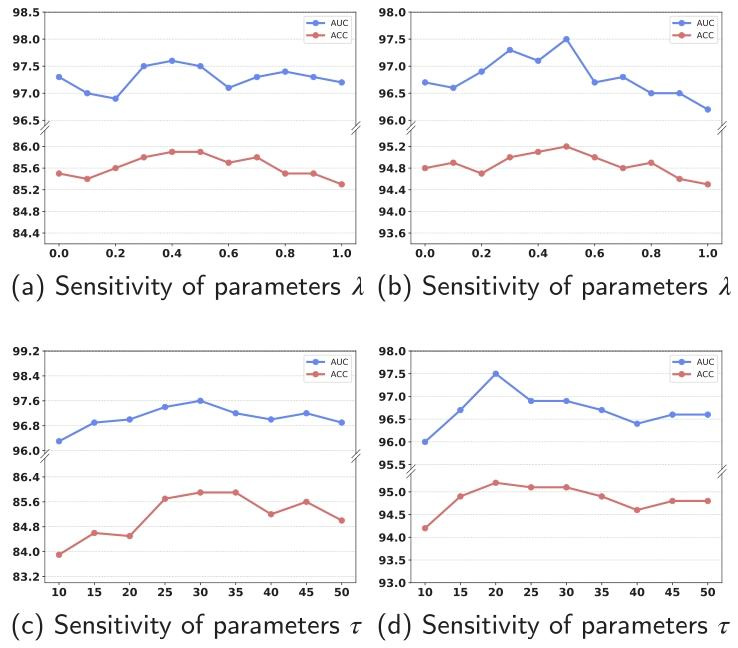
Fig. 7. Comparison of accuracy scores with different values of ?? and ??, respectively.
图7. 分别使用不同??和??值时的准确率对比
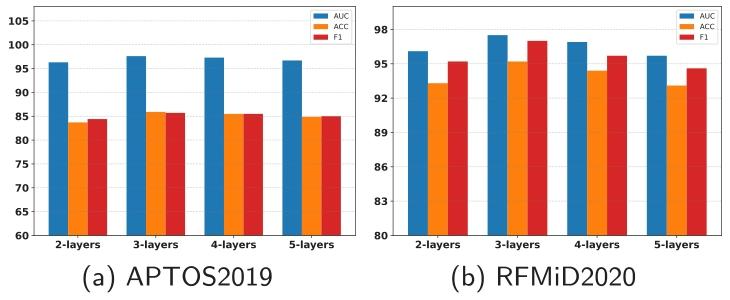
Fig. 8. Comparison of AUC, ACC and F1 scores with different depths of encoder.
图8. 不同编码器深度下的AUC、ACC和F1分数对比
Table
表
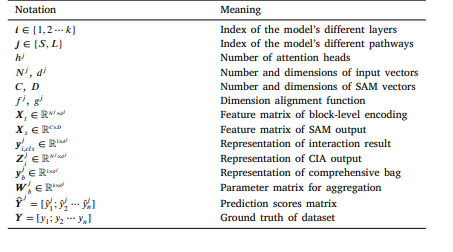
Table 1 Table of main notations used in this paper.
表1 本文使用的主要符号表
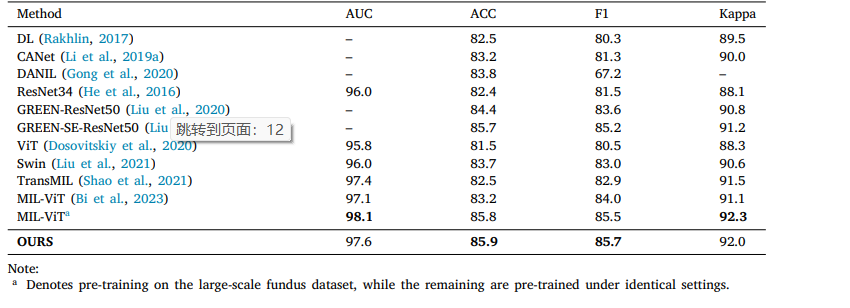
Table 2 Classification performance of various methods on APTOS2019 dataset.
表2 不同方法在APTOS2019数据集上的分类性能
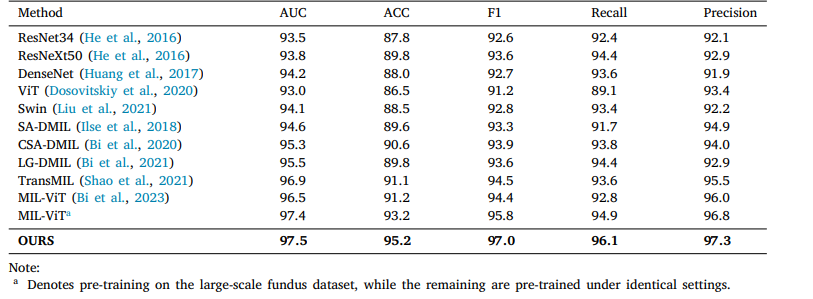
Table 3 Classification performance of various methods on RFMiD2020 dataset.
表3 不同方法在RFMiD2020数据集上的分类性能
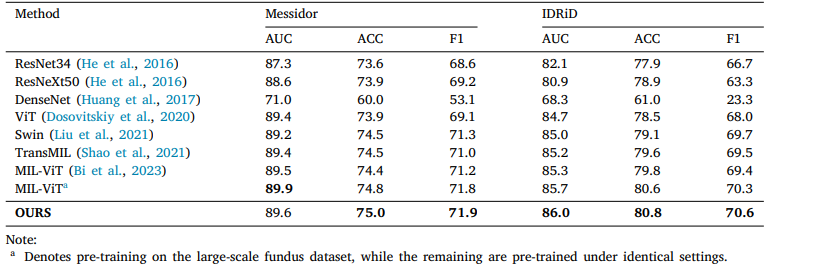
Table 4 Classification performance of various methods on messidor and IDRiD datasets.
表4 不同方法在Messidor和IDRiD数据集上的分类性能
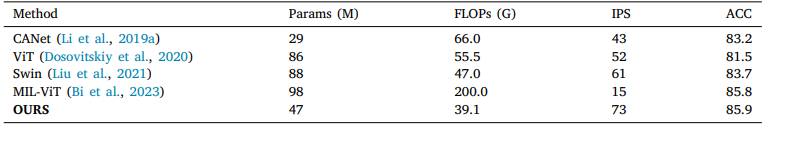
Table 5 Computational efficiency comparison of mainstream models on APTOS2019 dataset.
表5 主流模型在APTOS2019数据集上的计算效率对比
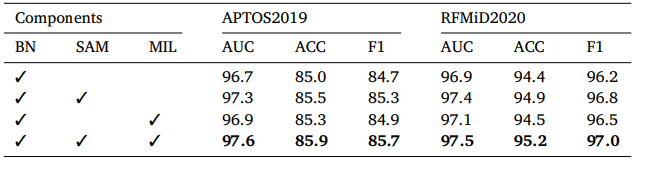
Table 6 Classification performance of various component on APTOS2019 AND RFMiD2020 datasets.
表6 不同组件在APTOS2019和RFMiD2020数据集上的分类性能
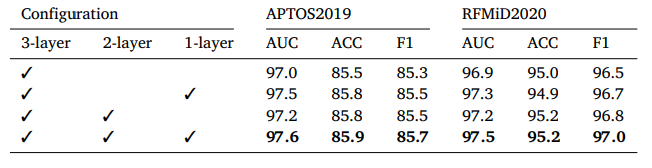
Table 7 Classification performance of various layer on APTOS2019 AND RFMiD2020 datasets.
表7 不同层在APTOS2019和RFMiD2020数据集上的分类性能
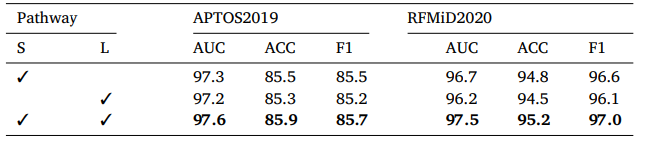
Table 8 Classification performance of various pathway on APTOS2019 and RFMiD2020 datasets.
表8 不同路径在APTOS2019和RFMiD2020数据集上的分类性能