一、绘制图像基础
import matplotlib.pyplot as plt# 1、创建画布
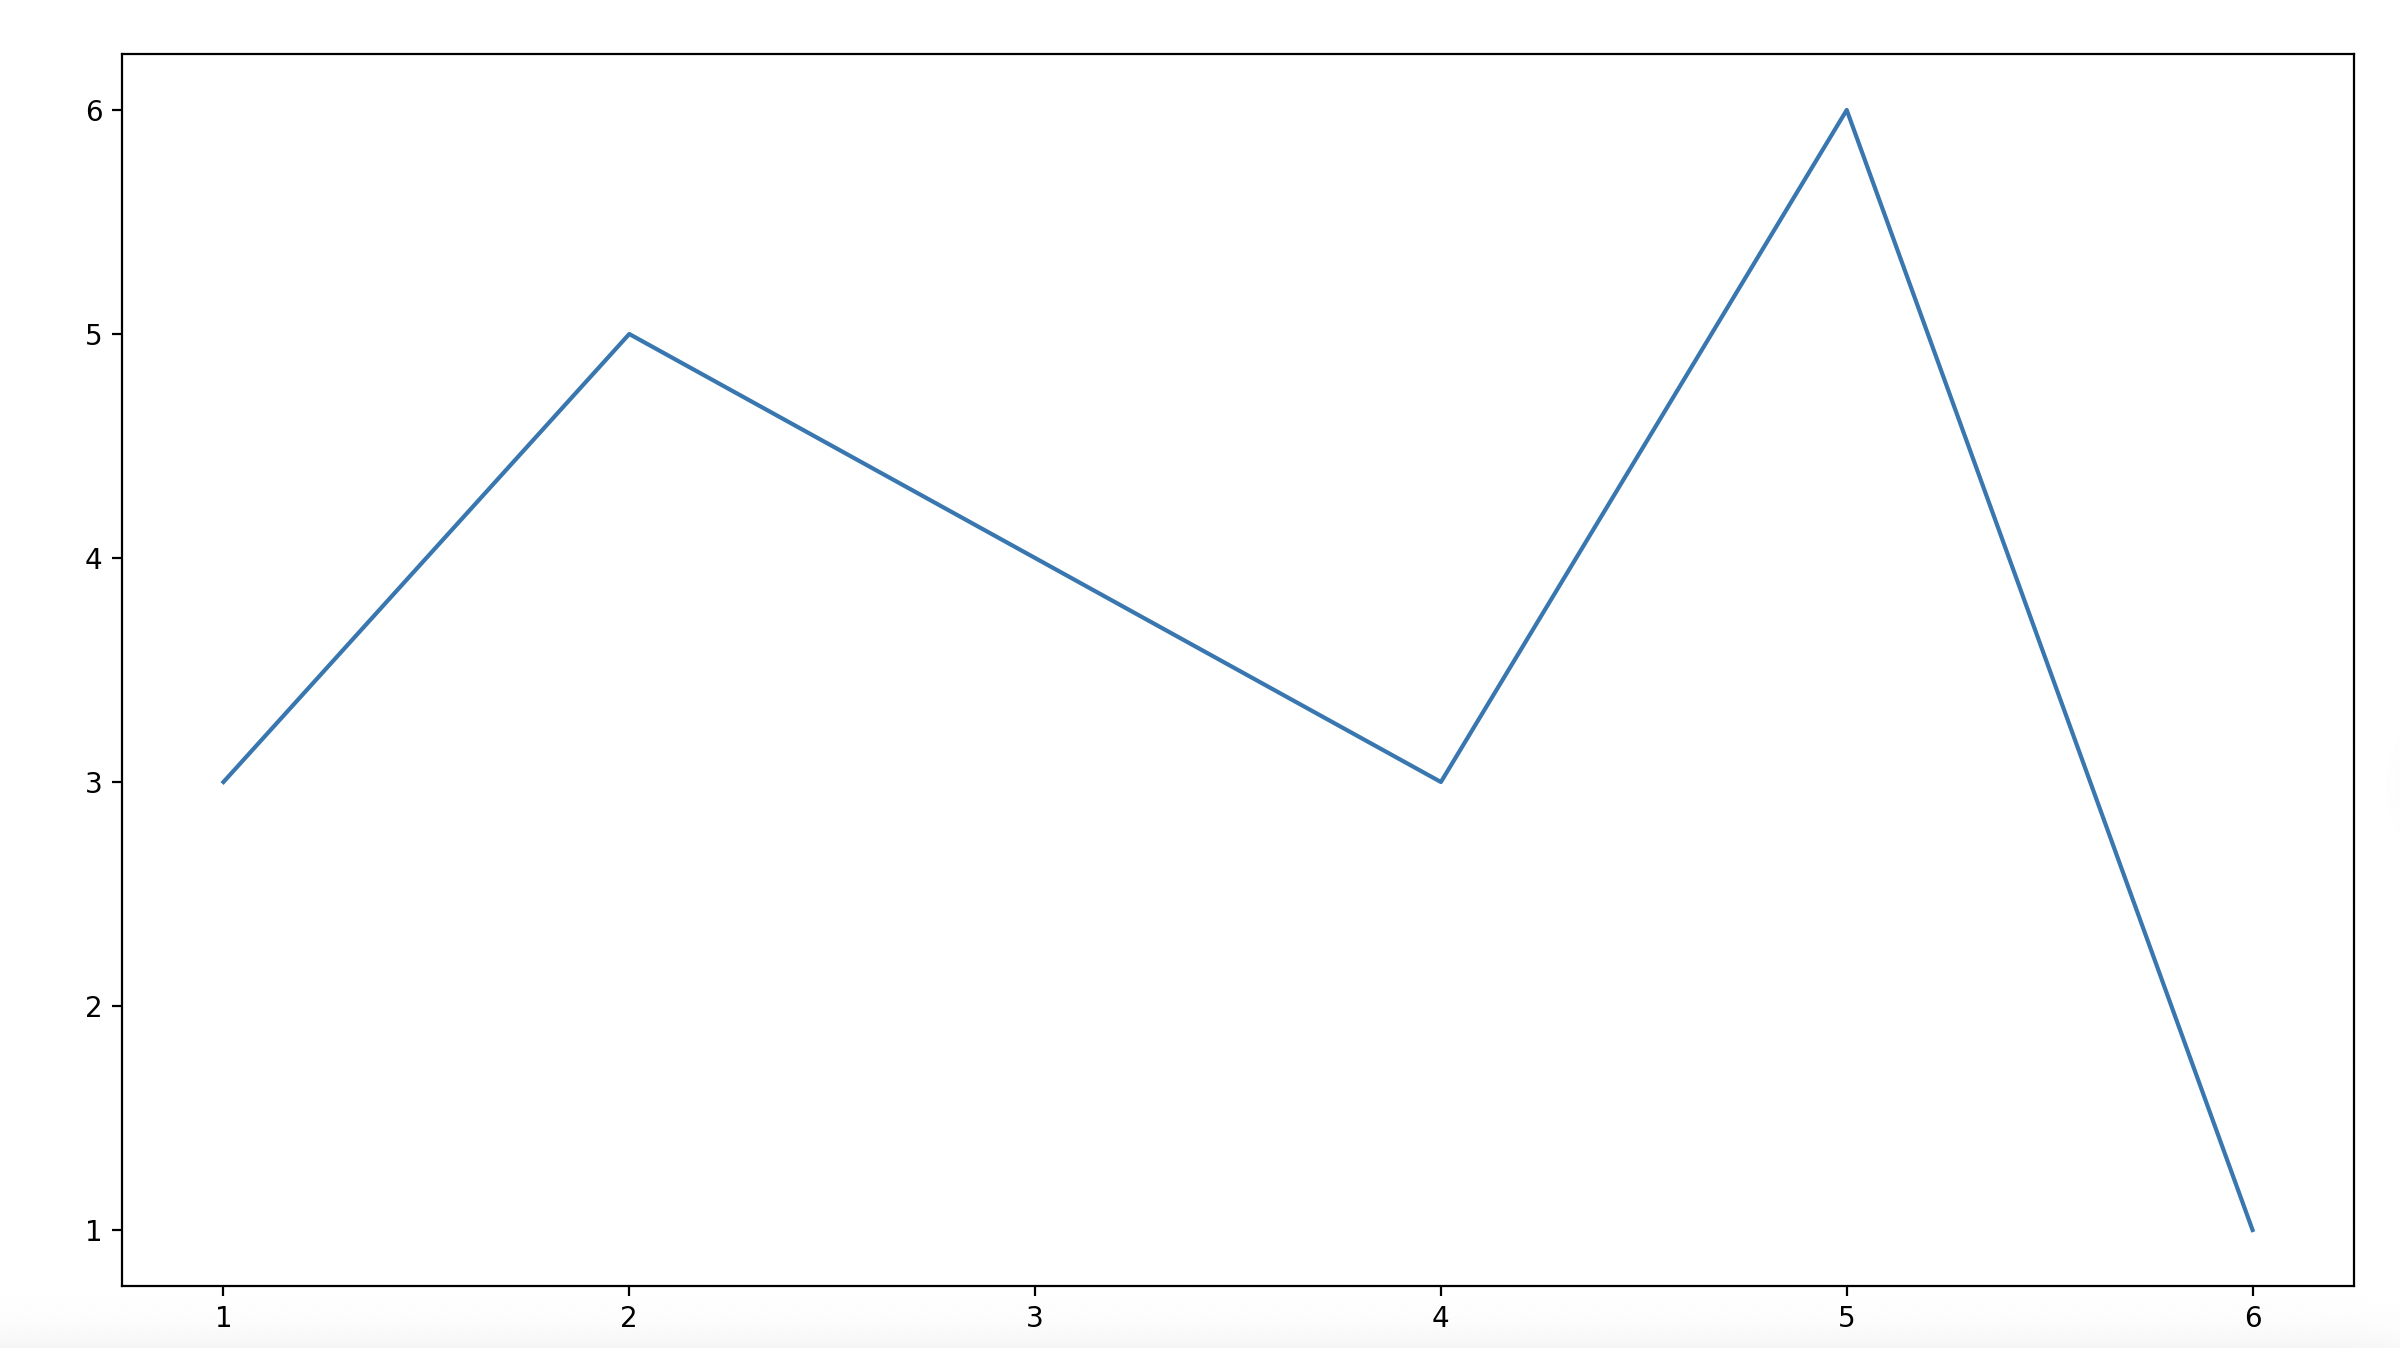
plt.figure(figsize=(20, 8), dpi=100)
# 2、绘制图像
x = [1, 2, 3, 4, 5, 6]
y = [3, 5, 4, 3, 6, 1]
plt.plot(x, y)
# 3、显示图像
plt.show()
二、图像保存
import matplotlib.pyplot as plt# 1、创建画布
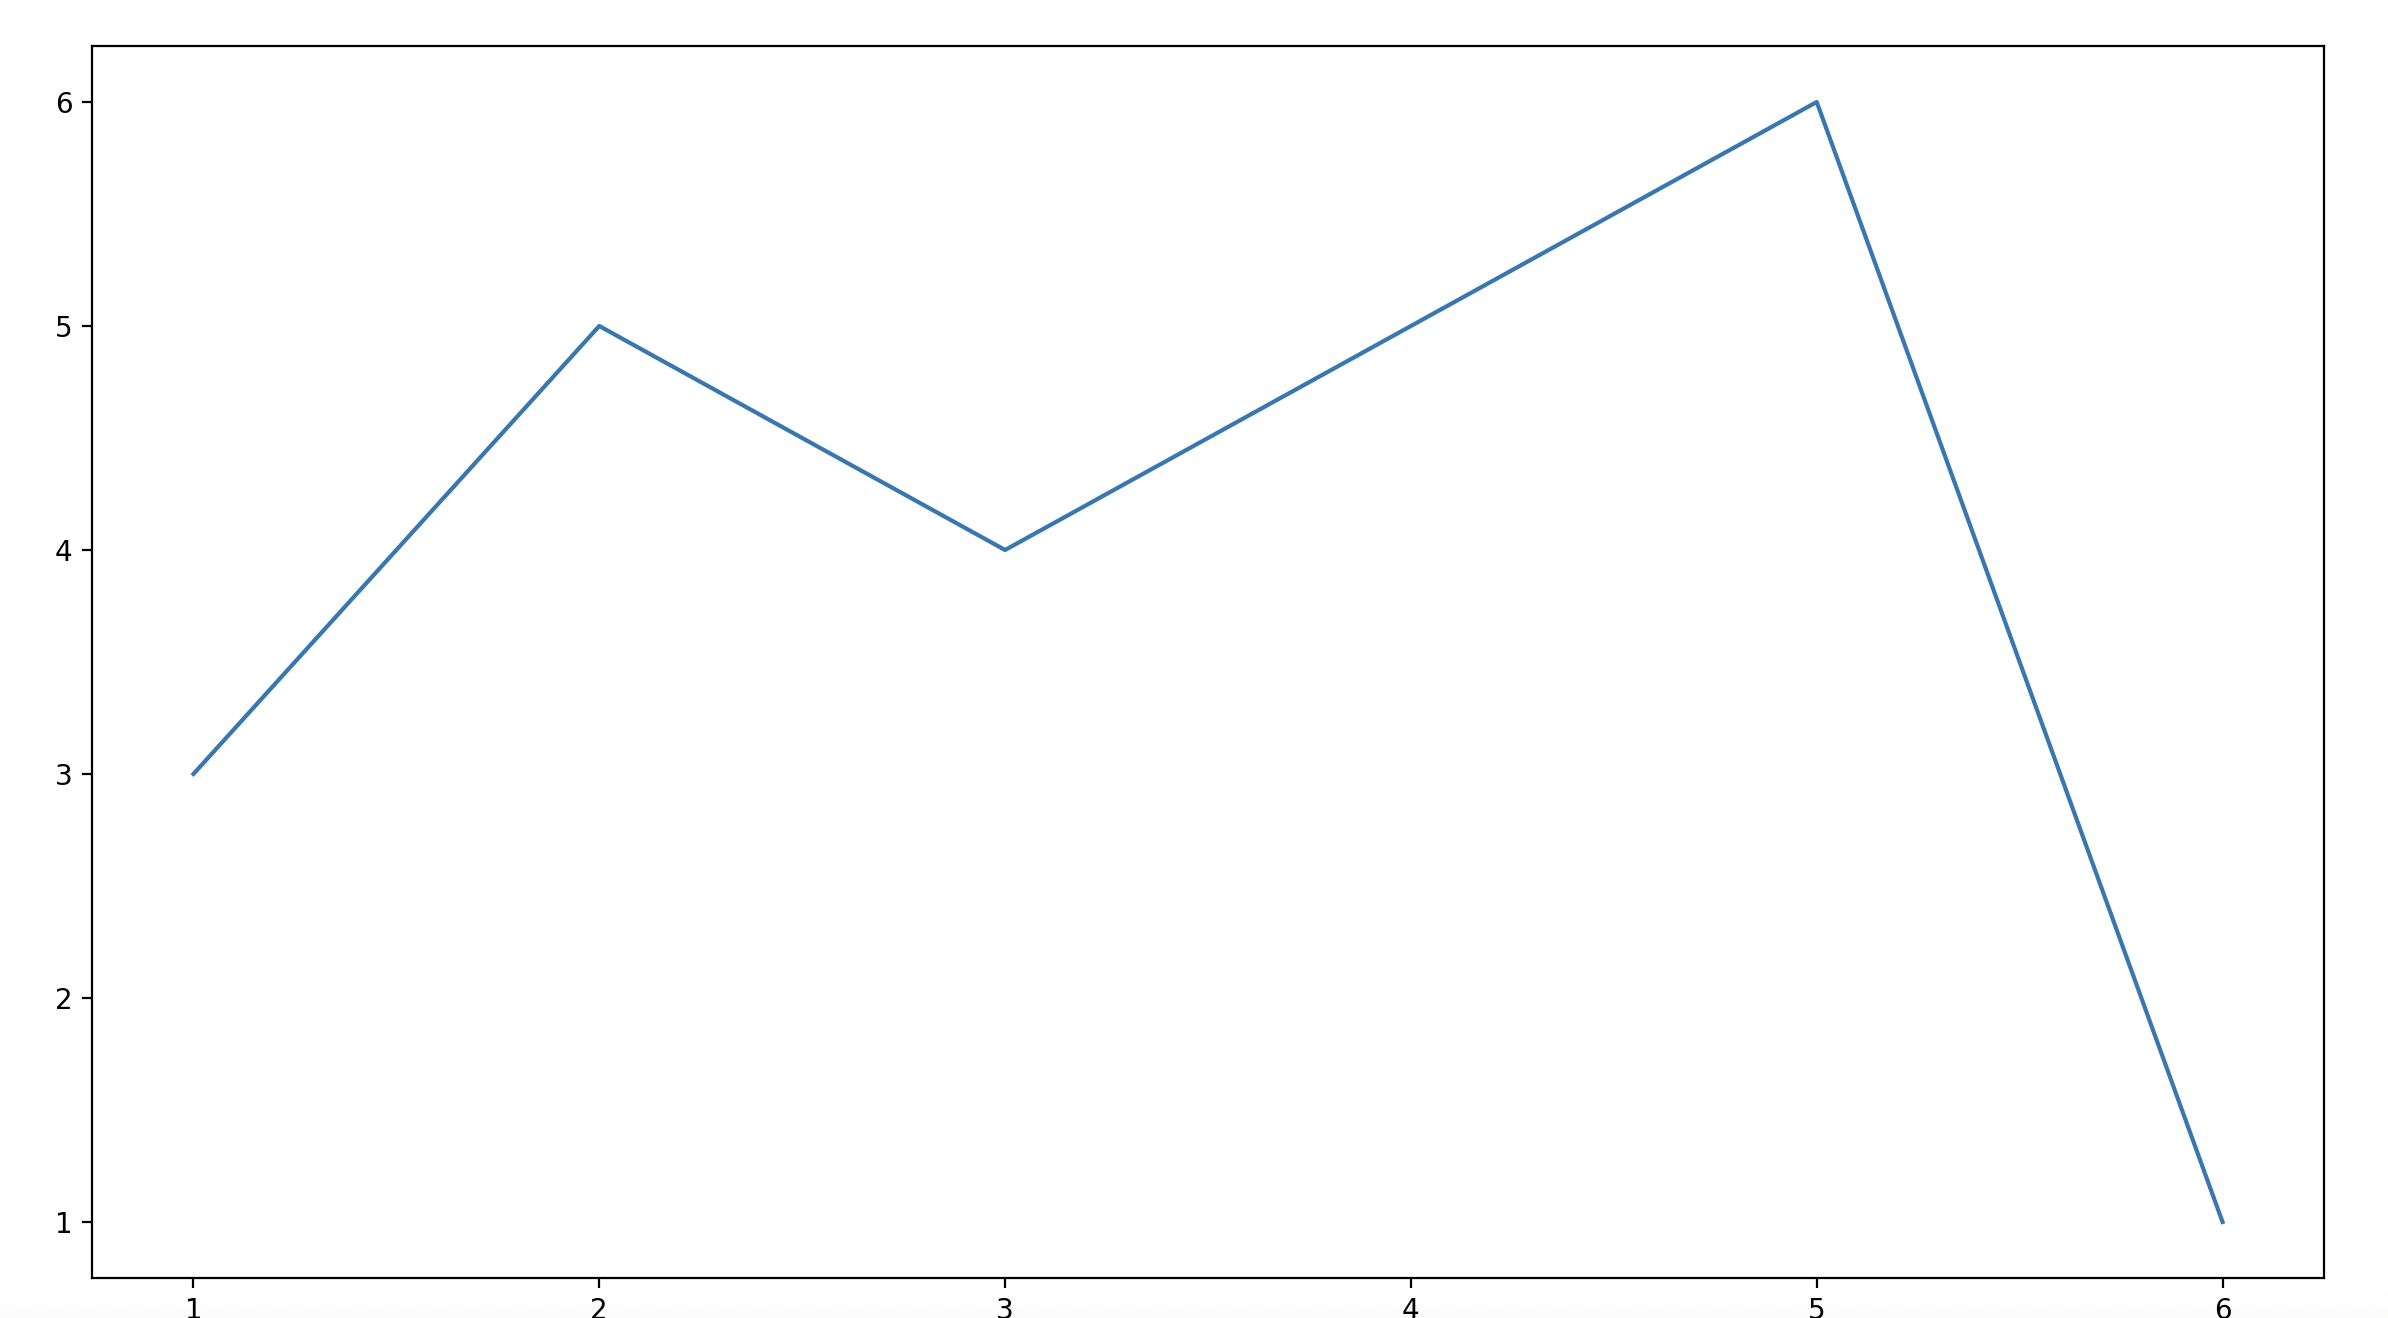
plt.figure(figsize=(20,8),dpi=100)
# 2、绘制图像
x = [1,2,3,4,5,6]
y = [3,5,4,5,6,1]
plt.plot(x,y)
# 2.1、图像保存(一定要放在show前面)
plt.savefig("./data/test3.png")
# 3、显示图像
plt.show()
三、案例:图像基本绘制
import matplotlib.pyplot as plt
import randomx = range(60)
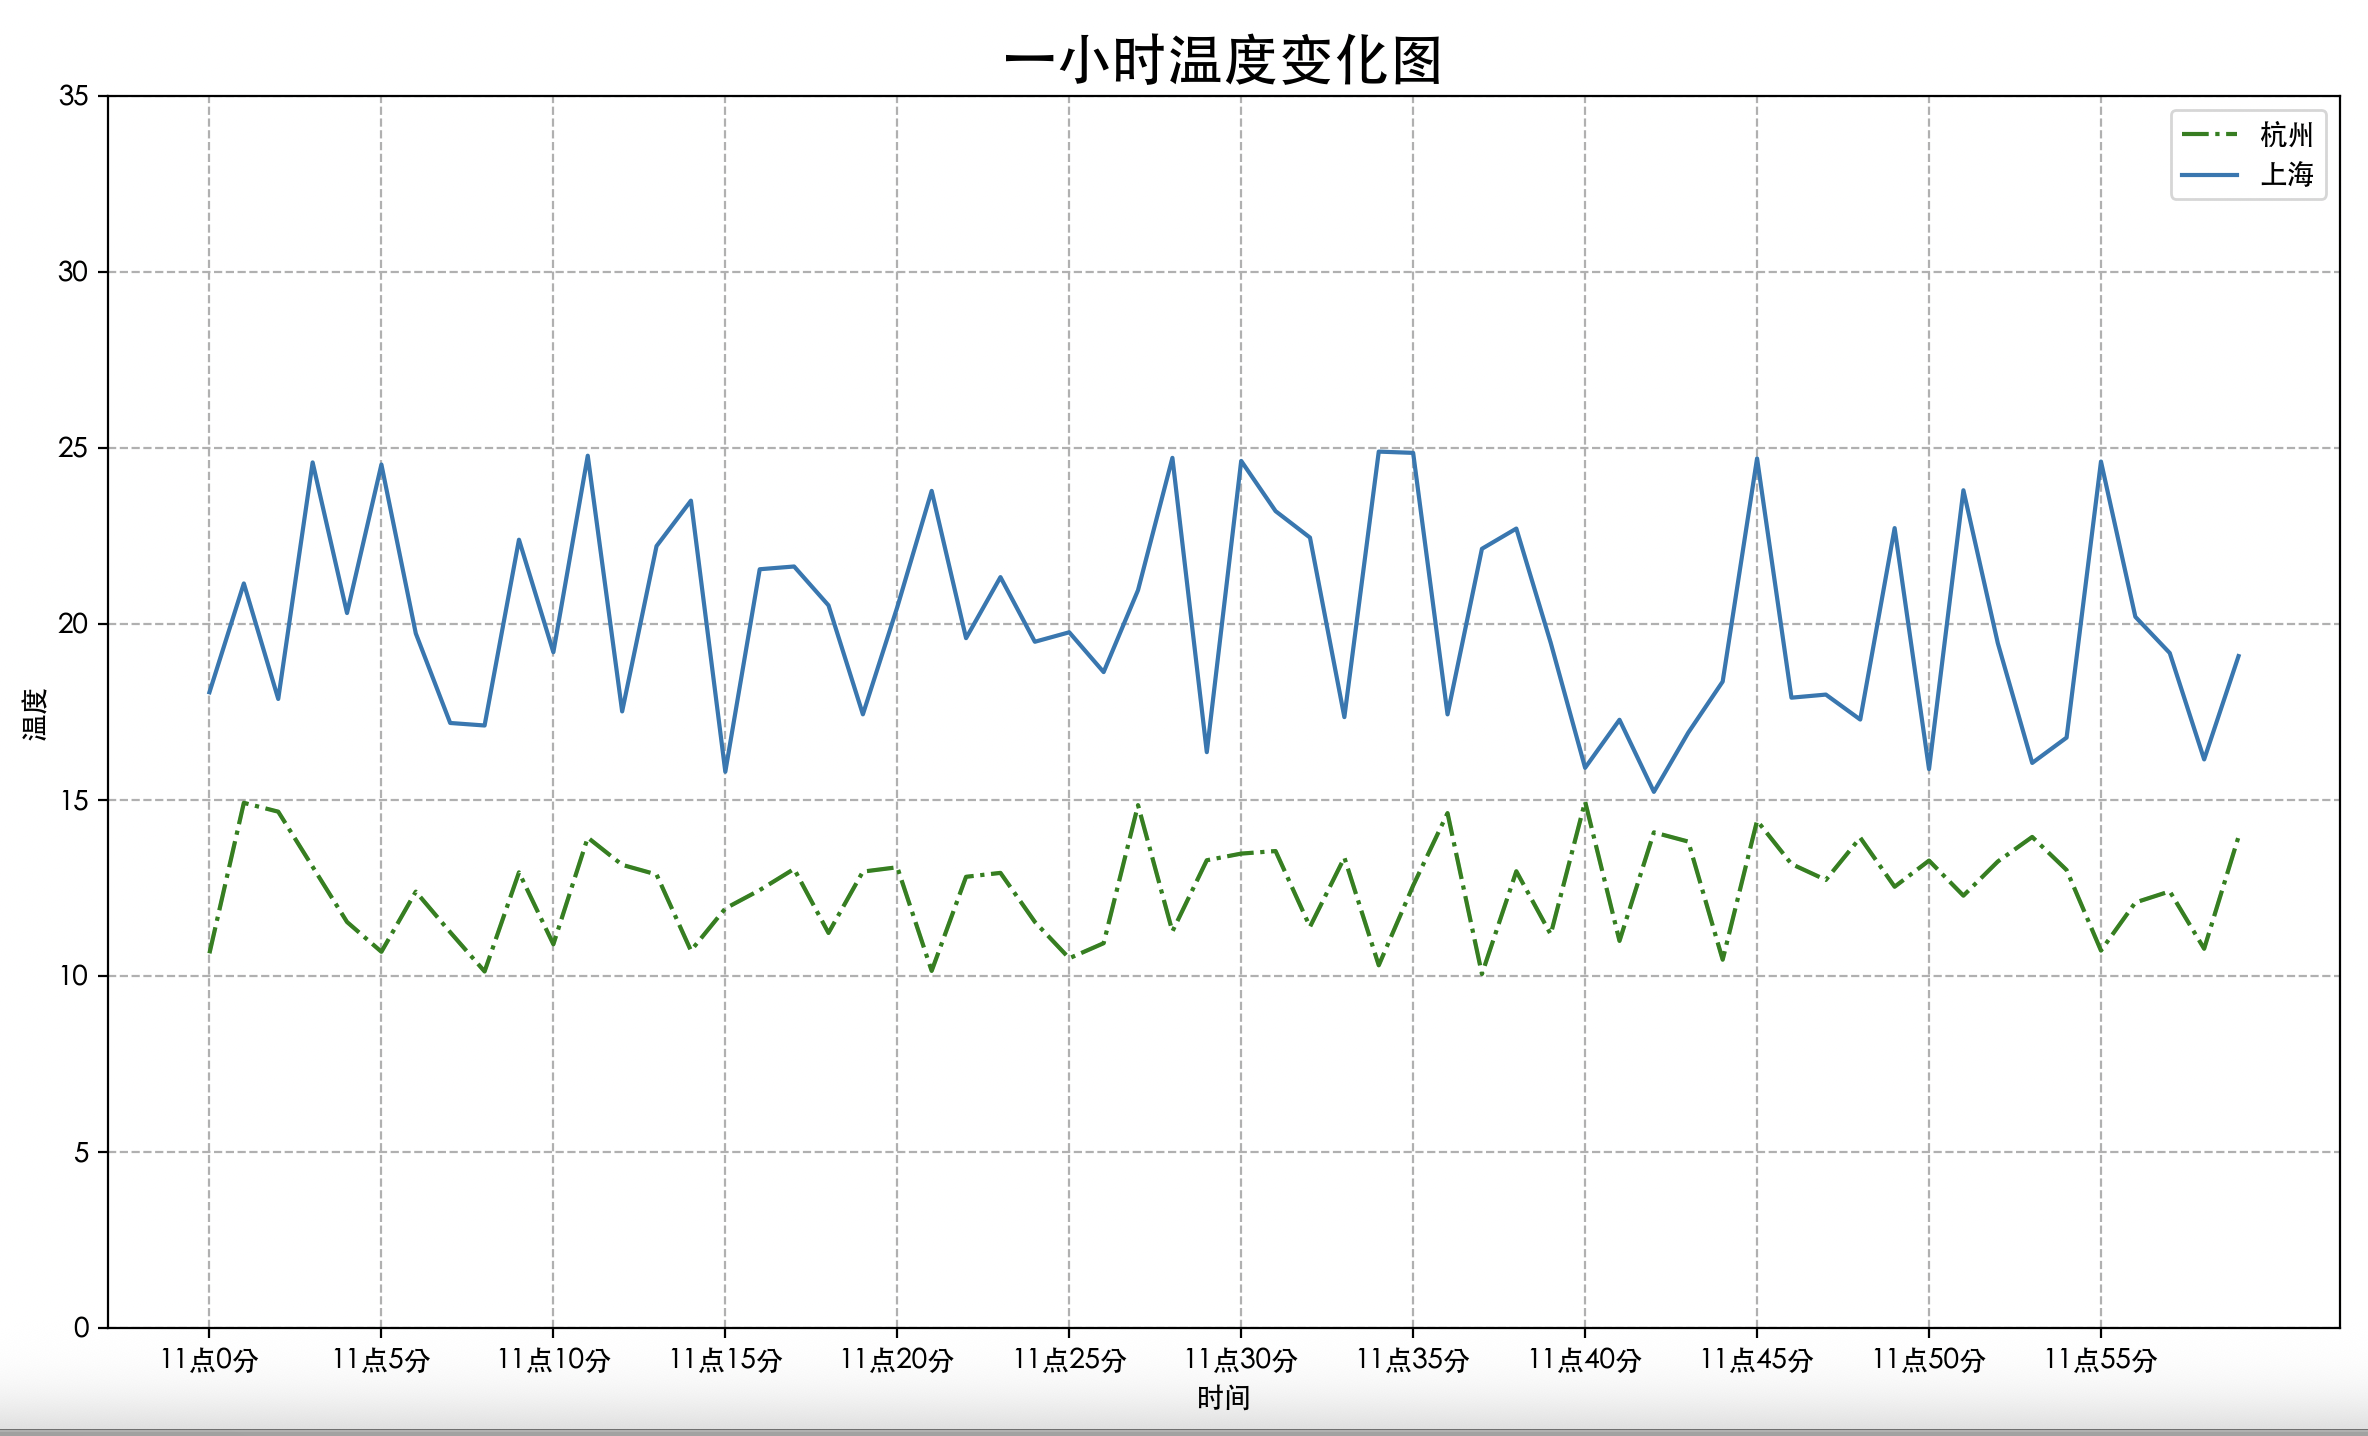
y_hangzhou = [random.uniform(10, 15) for i in x]
y_shanghai = [random.uniform(15, 25) for i in x]
# 1、创建画布
plt.figure(figsize=(20, 8), dpi=100)
# 2、绘制图像
plt.plot(x, y_hangzhou, label="杭州", color="g", linestyle="-.")
plt.plot(x, y_shanghai, label="上海")
# 2.1、添加x,y轴
y_ticks = range(40)
x_ticks_labels = ["11点{}分".format(i) for i in x]
plt.yticks(y_ticks[::5])
plt.xticks(x[::5], x_ticks_labels[::5])
# 2.2、添加网格
plt.grid(True, linestyle="--", alpha=1)
# 2.3、添加描述
plt.xlabel("时间")
plt.ylabel("温度")
plt.title("一小时温度变化图", fontsize=20)
# 2.4、显示图例
plt.legend(loc=0)
# 3、显示图像
plt.rcParams["font.sans-serif"] = ["Heiti TC"] # 解决中文乱码
plt.rcParams["axes.unicode_minus"] = False # 解决保存图片为框
plt.show()
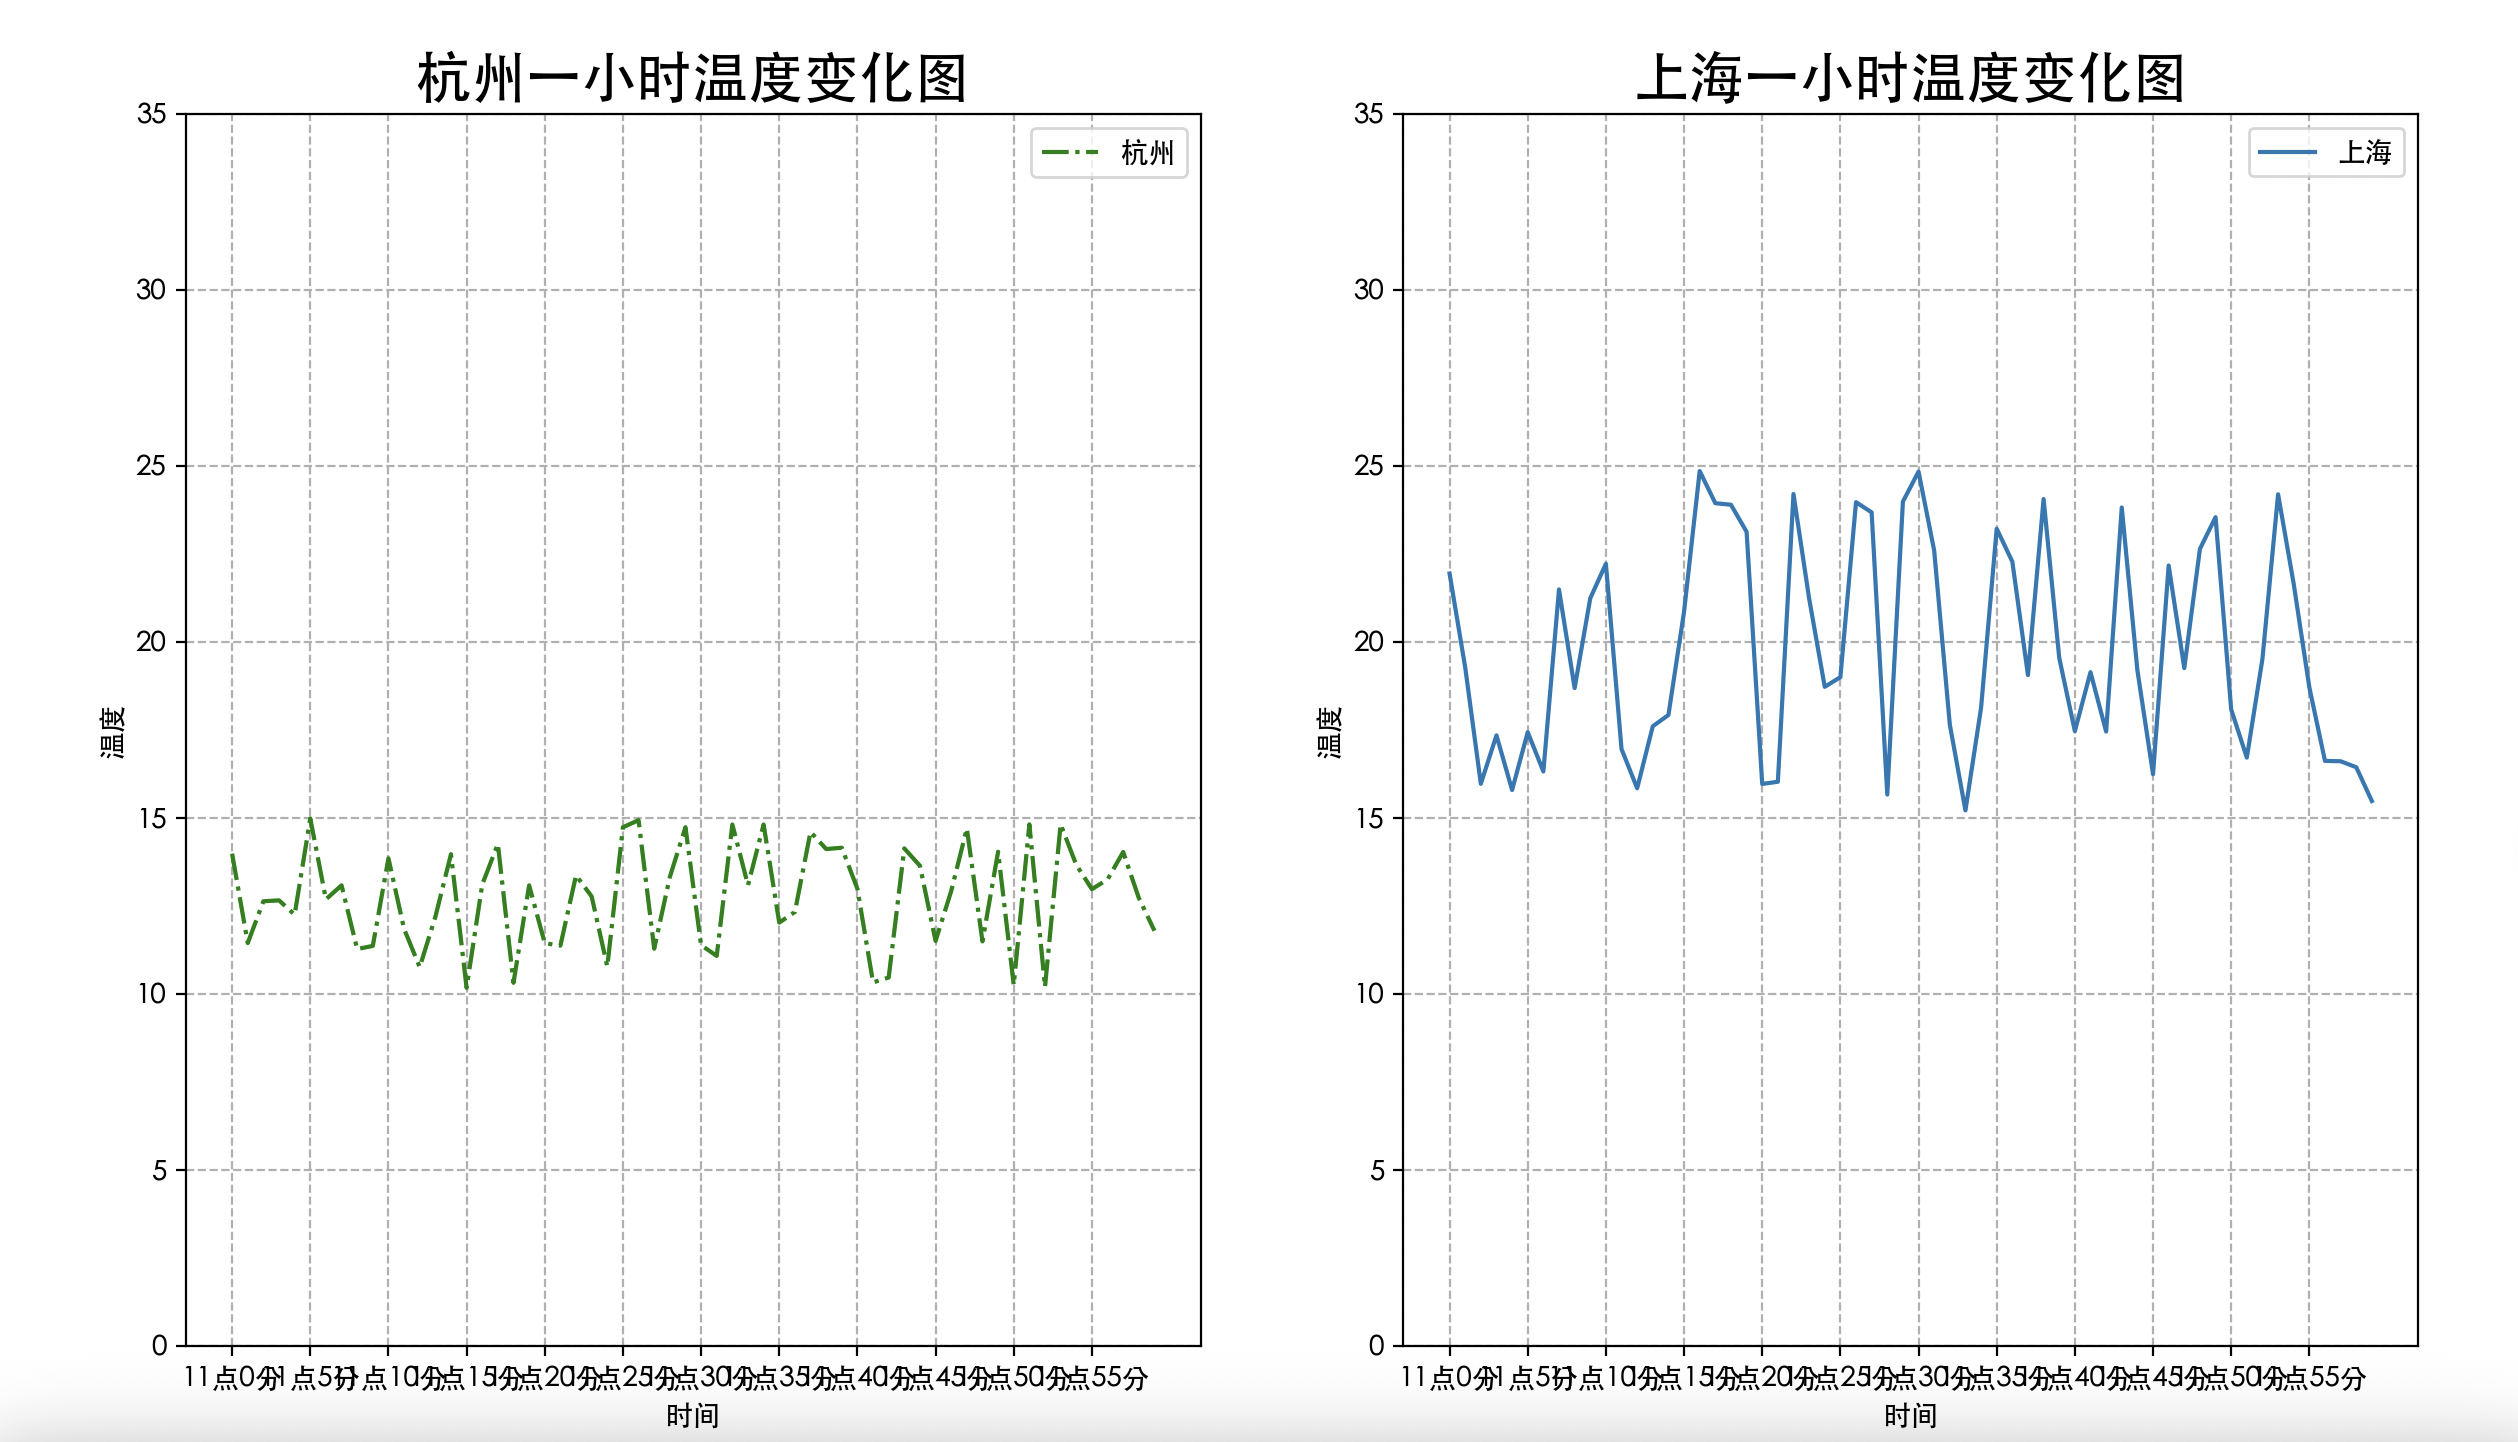
四、多个坐标显示图像
import matplotlib.pyplot as plt
import randomx = range(60)
y_hangzhou = [random.uniform(10, 15) for i in x]
y_shanghai = [random.uniform(15, 25) for i in x]
# # 1、创建画布
fig, axes = plt.subplots(nrows=1, ncols=2, figsize=(20, 8), dpi=100)
# # 2、绘制图像
axes[0].plot(x, y_hangzhou, label="杭州", color="g", linestyle="-.")
axes[1].plot(x, y_shanghai, label="上海")
# # 2.1、添加x,y轴
y_ticks = range(40)
x_ticks_labels = ["11点{}分".format(i) for i in x]
axes[0].set_xticks(x[::5])
axes[0].set_yticks(y_ticks[::5])
axes[0].set_xticklabels(x_ticks_labels[::5])
axes[1].set_xticks(x[::5])
axes[1].set_yticks(y_ticks[::5])
axes[1].set_xticklabels(x_ticks_labels[::5])
# # 2.2、添加网格
axes[0].grid(True, linestyle="--", alpha=1)
axes[1].grid(True, linestyle="--", alpha=1)
# # 2.3、添加描述
axes[0].set_xlabel("时间")
axes[0].set_ylabel("温度")
axes[0].set_title("杭州一小时温度变化图", fontsize=20)
axes[1].set_xlabel("时间")
axes[1].set_ylabel("温度")
axes[1].set_title("上海一小时温度变化图", fontsize=20)
# # 2.4、显示图例
axes[0].legend(loc=0)
axes[1].legend(loc=0)
# 3、显示图像
plt.rcParams["font.sans-serif"] = ["Heiti TC"]  # 解决中文乱码
plt.show()
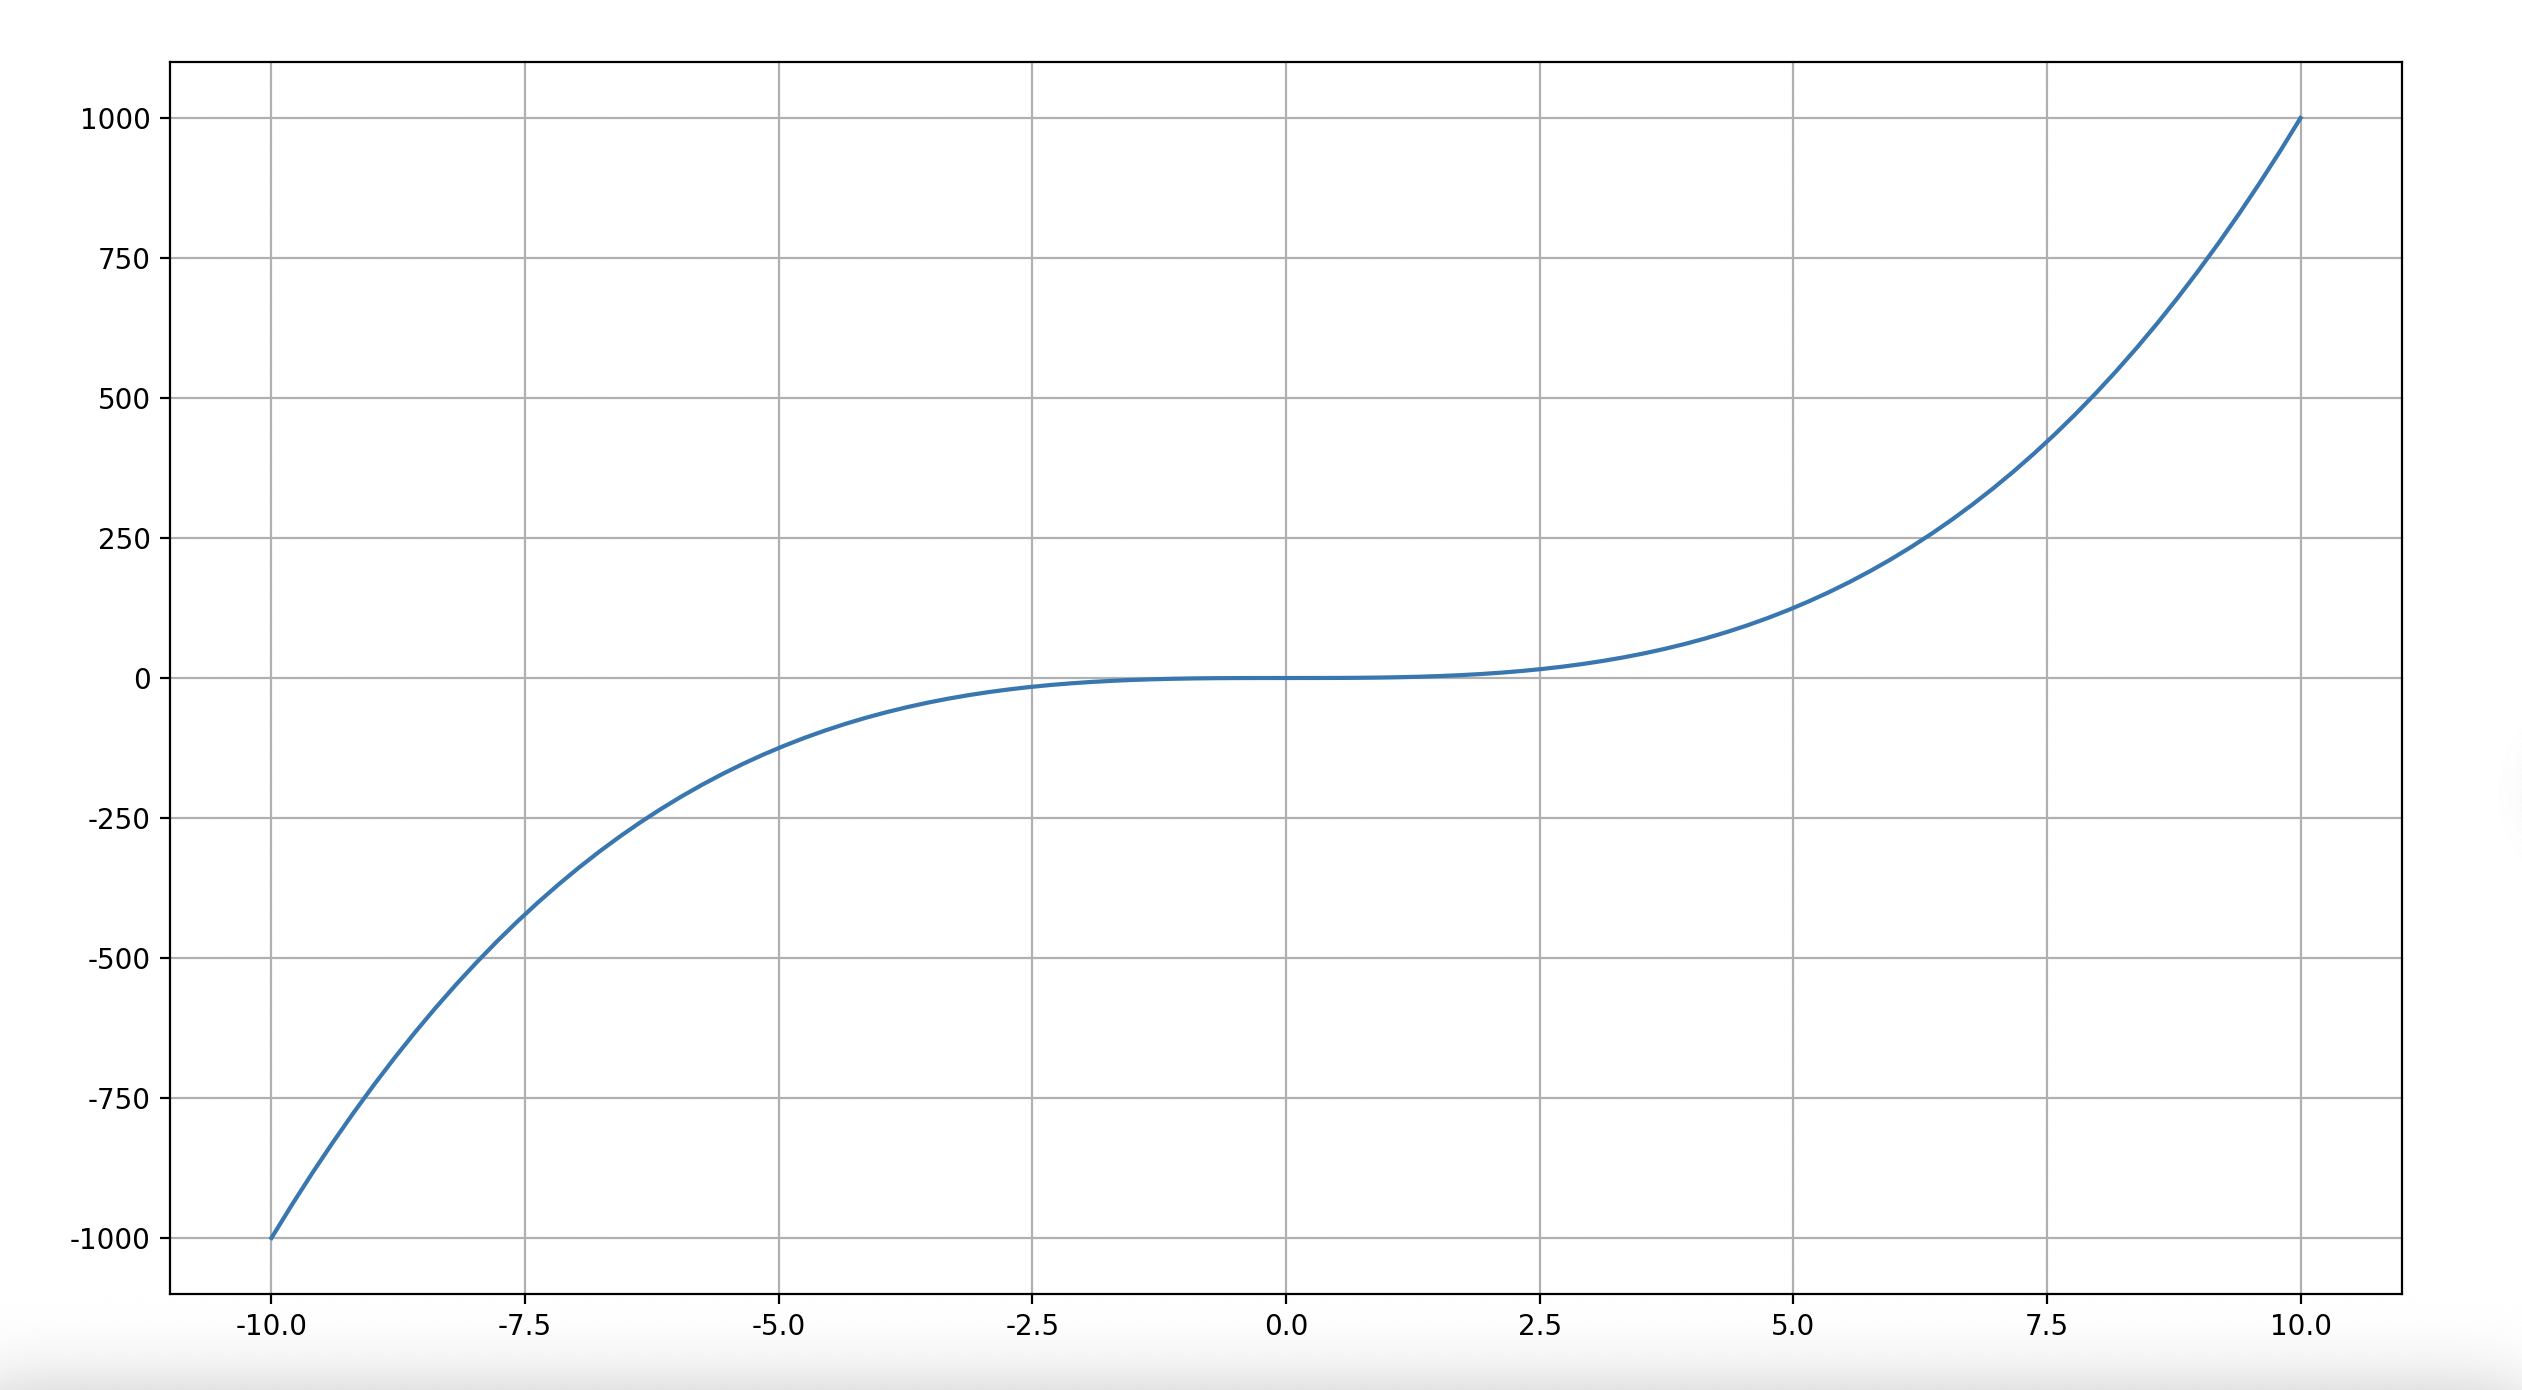
五、应用场景:绘制数学图像
import numpy as np
import matplotlib.pyplot as plt# 0、生成数据
x = np.linspace(-10, 10, 100)
# y = np.sin(x)
y = x * x * x
# 1、创建画布
plt.figure(figsize=(20, 8), dpi=100)
# 2、绘制
plt.plot(x, y)
plt.grid()
# 3、显示图像
plt.show()
常见图形绘制
1.折线图--plt.plot         ——变化
2.散点图--plt.scatter()    ——分布规律
3.柱状图--plt.bar          ——统计、对比
4.直方图--plt.hist()       ——统计,分布
5.饼图--plt.pie()          ——占比
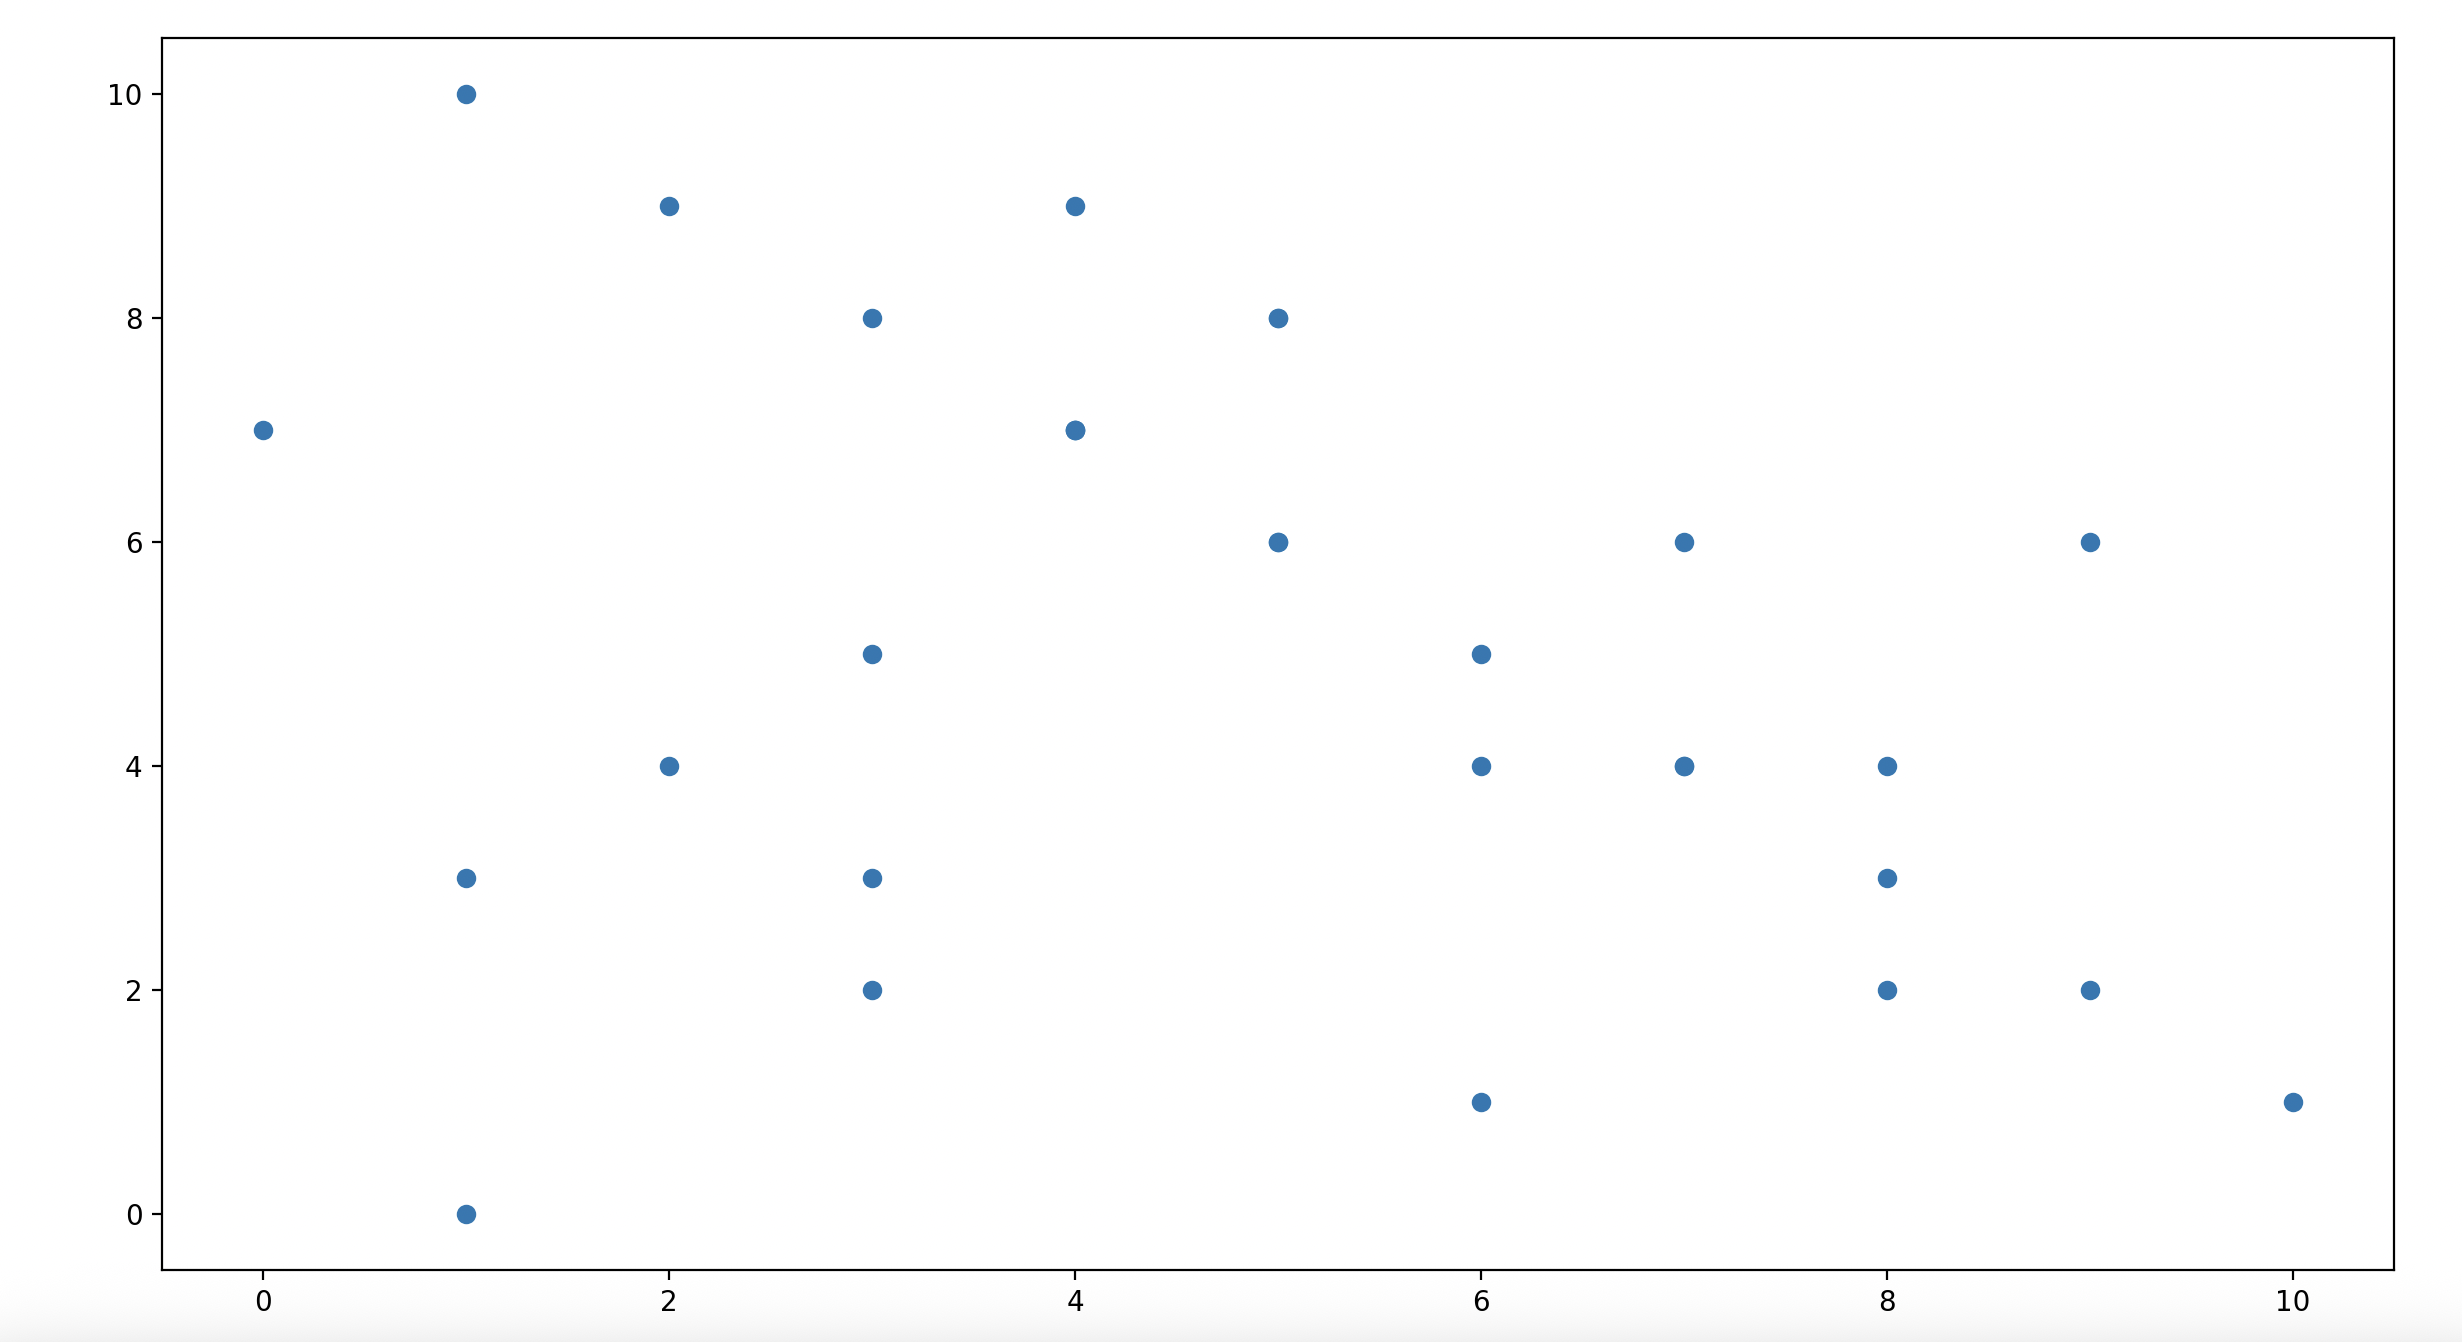
六、散点图
import matplotlib.pyplot as pltx = [1, 2, 3, 4, 5, 6, 7, 8, 9, 10, 5, 6, 3, 3, 4, 5, 7, 8, 4, 1, 1, 2, 3, 4, 5, 6, 7, 8, 9, 0]
y = [10, 9, 8, 7, 6, 5, 4, 3, 2, 1, 6, 4, 3, 2, 7, 8, 6, 4, 9, 0, 3, 4, 5, 7, 8, 1, 4, 2, 6, 7]
# 1、创建画布
plt.figure(figsize=(20, 8), dpi=100)
# 2、图像绘制
plt.scatter(x, y)
# 3、图像展示
plt.show()
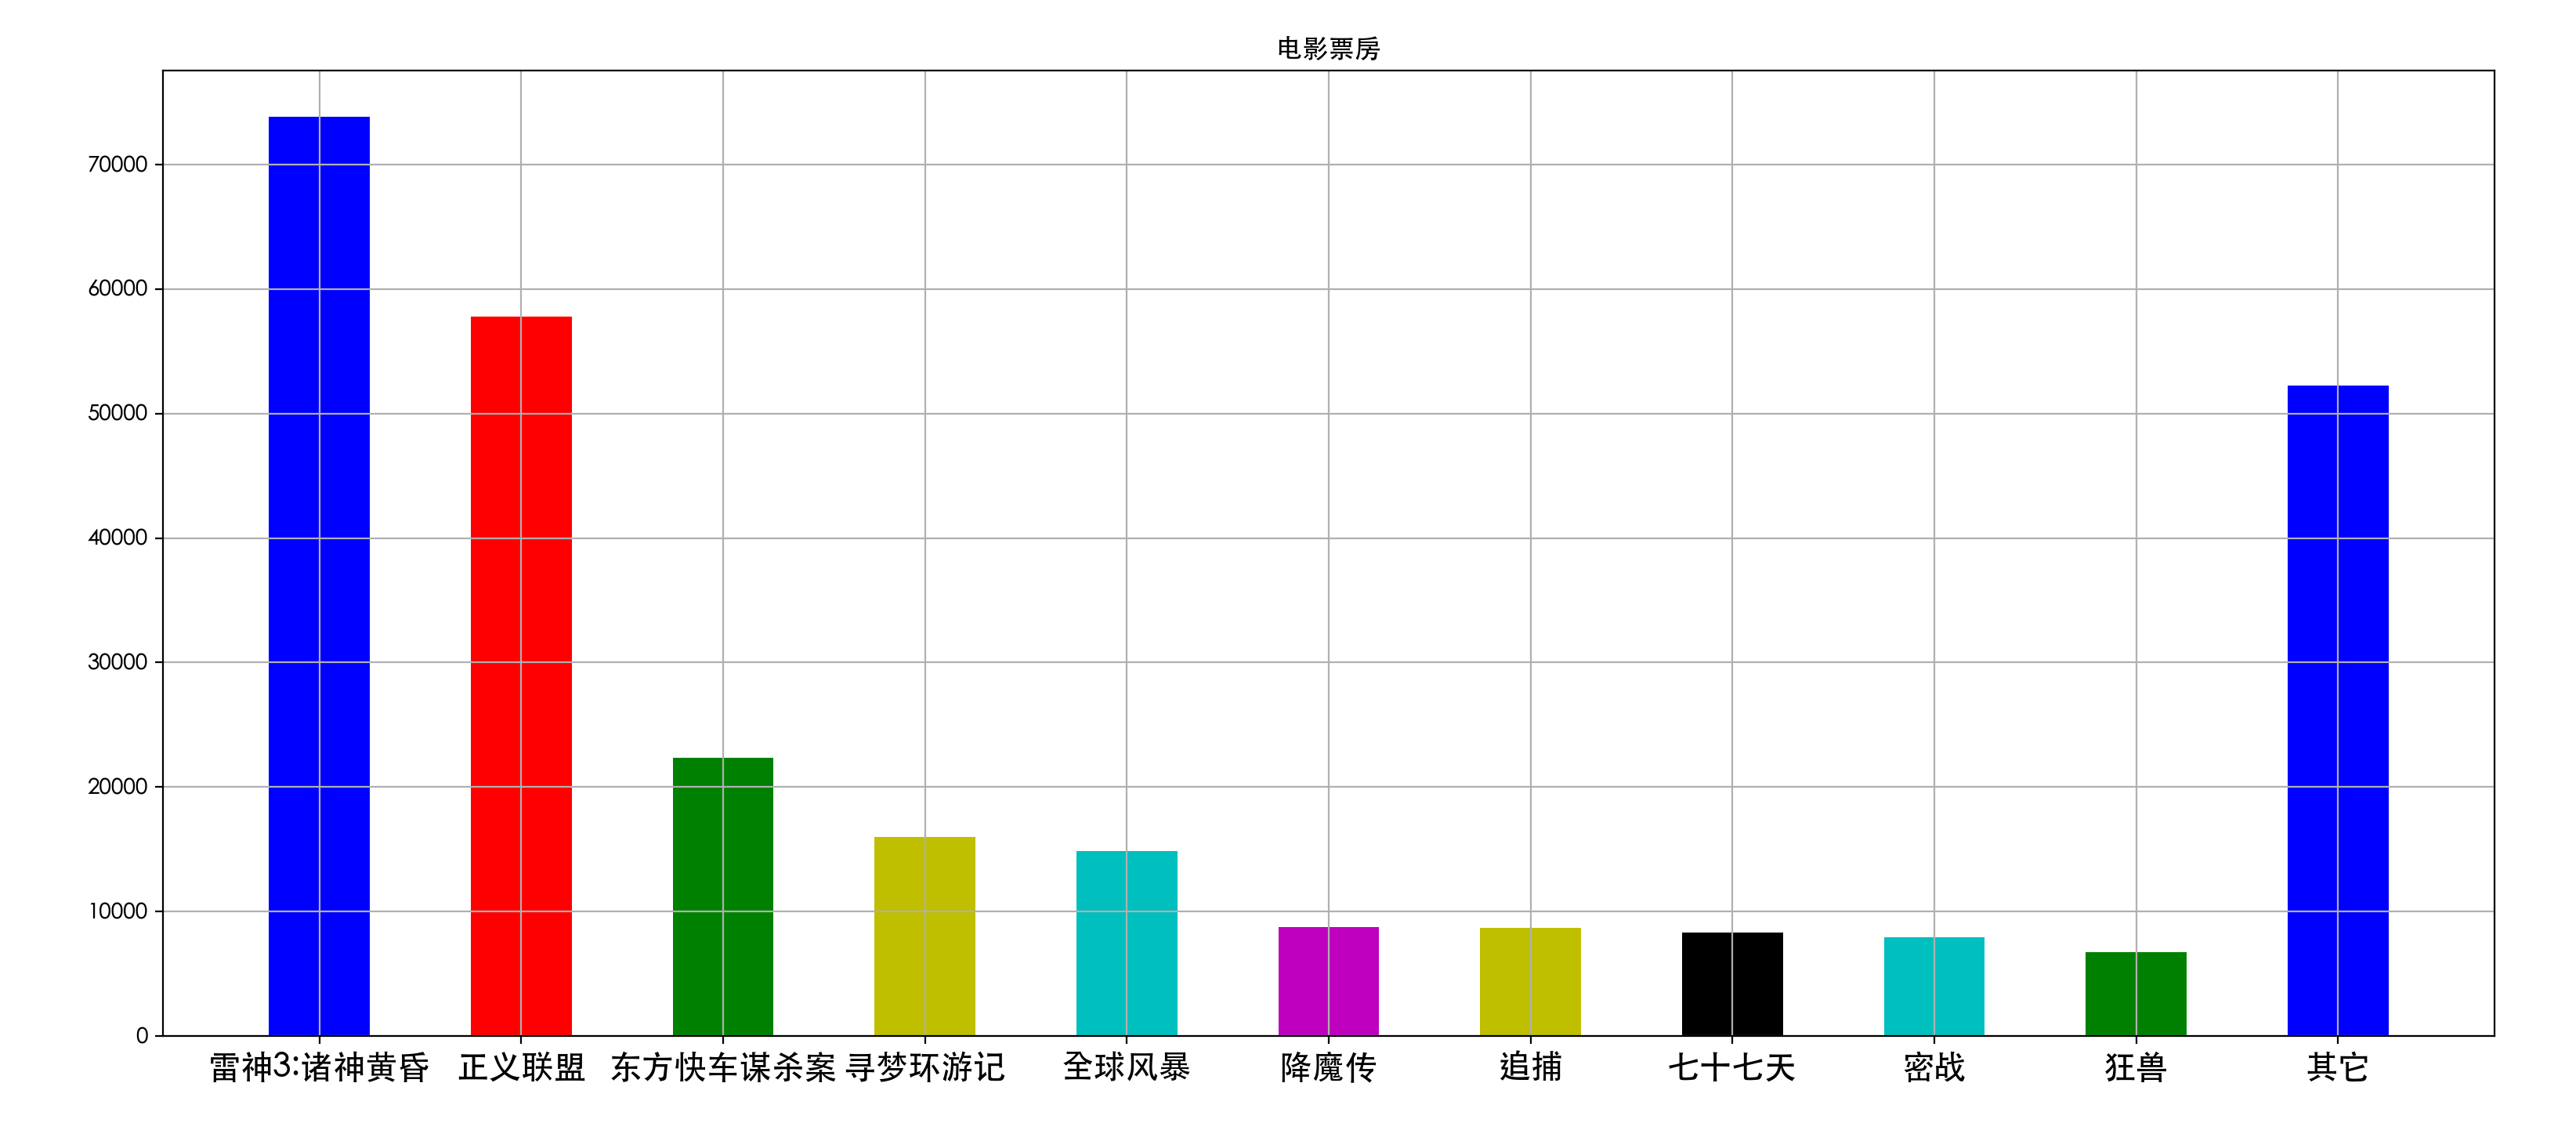
七、柱状图
import matplotlib.pyplot as pltmovie_name = ['雷神3:诸神黄昏', '正义联盟', '东方快车谋杀案', '寻梦环游记', '全球风暴', '降魔传', '追捕', '七十七天','密战', '狂兽', '其它']
x = range(len(movie_name))
y = [73853, 57767, 22354, 15969, 14839, 8725, 8716, 8318, 7916, 6764, 52222]
# 1、创建画布
plt.figure(figsize=(30, 8), dpi=100)
# 2、图像绘制
plt.bar(x, y, color=['b', 'r', 'g', 'y', 'c', 'm', 'y', 'k', 'c', 'g', 'b'], width=0.5)
# 2.1、设置x轴
plt.xticks(x, movie_name, fontsize=15)
# 2.2、网格
plt.grid()
# 2.3、标题
plt.title("电影票房")
# 3、图像展示
plt.rcParams["font.sans-serif"] = ["Heiti TC"]  # 解决中文乱码
plt.rcParams["axes.unicode_minus"] = False  # 解决保存图片为框
plt.show()