利用SAMap整合跨物种单细胞/空间转录组数据
目录
BLAST比对
导入环境
构建SM对象
整合跨物种对象
保存结果
保存整合anndata及可视化
导入相关包
提取anndata对象
整合UMAP可视化
指定基因可视化
桑基图可视化
相似性热图可视化
之前的帖子详细介绍了如何从参考基因组和注释中提取蛋白序列,利用提取的编码蛋白序列,以及经过预处理的单细胞/空间转录组的H5ad格式数据,我们就可以进行SAMap的跨物种数据整合
代码思路详见GitHub - atarashansky/SAMap: SAMap: Mapping single-cell RNA sequencing datasets from evolutionarily distant organisms.
BLAST比对
首先我们需要将提取的蛋白编码序列,也就是最长转录本的序列进行一一比对,有多少个物种就需要依次进行比对,
如有物种ABC,我们需要进行的比对则如下,每个物种需要用两个字母的缩写来代称,我这里对应的是aa/bb/cc,比对结果文件夹也会用上述缩写名称表示为aabb/aacc/bbcc,每个文件夹下是两个txt比对文件
bash map_genes.sh --tr1 A_protein_longest.fa --t1 prot --n1 aa --tr2 B_protein_longest.fa --t2 prot --n2 bb
bash map_genes.sh --tr1 A_protein_longest.fa --t1 prot --n1 aa --tr2 C_protein_longest.fa --t2 prot --n2 cc
bash map_genes.sh --tr1 B_protein_longest.fa --t1 prot --n1 bb --tr2 C_protein_longest.fa --t2 prot --n2 cc
官方提供的比对脚本如下所示(可以自己进行单独的BLAST,但是要保持同样的文件命名规则才可以继续进行整合)
#!/bin/bash#parse arguments
die() {printf '%s\n' "$1" >&2exit 1
}_help() {printf "Usage: map_genes.sh [--tr1] [--t1] [--n1] [--tr2] [--t2] [--n2]\n\t[--tr1]: path to transcriptome/proteome 1\n\t[--t1]: is 1 a transcriptome [nucl] or proteome [prot]\n\t[--n1]: two character identifier of 1\n\t[--tr2]: path to transcriptome/proteome 2\n\t[--t2]: is 2 a transcriptome [nucl] or proteome [prot]\n\t[--n2]: two character identifier of 2"
}if [ $# -eq 0 ]; then_helpexit 1
fiwhile :; docase $1 in-h|-\?|--help)_helpexit;;--tr1)       # Takes an option argument; ensure it has been specified.if [ "$2" ]; thentr1=$2shiftelsedie 'ERROR: "--tr1" requires a non-empty option argument.'fi;;--tr2)       # Takes an option argument; ensure it has been specified.if [ "$2" ]; thentr2=$2shiftelsedie 'ERROR: "--tr2" requires a non-empty option argument.'fi;;--n1)       # Takes an option argument; ensure it has been specified.if [ "$2" ]; thenn1=$2shiftelsedie 'ERROR: "--n1" requires a non-empty option argument.'fi;;--n2)       # Takes an option argument; ensure it has been specified.if [ "$2" ]; thenn2=$2shiftelsedie 'ERROR: "--n2" requires a non-empty option argument.'fi;;--t1)       # Takes an option argument; ensure it has been specified.if [ "$2" ]; thent1=$2shiftelsedie 'ERROR: "--t1" requires a non-empty option argument.'fi;;--t2)       # Takes an option argument; ensure it has been specified.if [ "$2" ]; thent2=$2shiftelsedie 'ERROR: "--t2" requires a non-empty option argument.'fi;;--threads)       # Takes an option argument; ensure it has been specified.if [ "$2" ]; thenn_threads=$2shiftfi;;--)              # End of all options.shiftbreak;;-?*)printf 'WARN: Unknown option (ignored): %s\n' "$1" >&2;;*)               # Default case: No more options, so break out of the loop.breakesacshift
doneif [ -z ${n_threads+x} ]; thenn_threads=8
fi#read -e -p 'Transcriptome 1: ' tr1
#read -e -p 'Transcriptome type: ' t1
#read -e -p 'Transcriptome ID: ' n1
#read -e -p 'Transcriptome 2: ' tr2
#read -e -p 'Transcriptome type: ' t2
#read -e -p 'Transcriptome ID: ' n2n1="${n1:0:2}"
n2="${n2:0:2}"mkdir -p "maps"
mkdir -p "maps/${n1}${n2}"if [ ! -f "${tr1}.nhr" ] && [ ! -f "${tr1}.phr" ]
then
makeblastdb -in $tr1 -dbtype $t1
fiif [ ! -f "${tr2}.nhr" ] && [ ! -f "${tr2}.phr" ]
then
makeblastdb -in $tr2 -dbtype $t2
fiif [[ "$t1" == "nucl" && "$t2" == "nucl" ]]
then
echo "Running tblastx in both directions"
tblastx -query $tr1 -db $tr2 -outfmt 6 -out "maps/${n1}${n2}/${n1}_to_${n2}.txt" -num_threads ${n_threads} -max_hsps 1 -evalue 1e-6
tblastx -query $tr2 -db $tr1 -outfmt 6 -out "maps/${n1}${n2}/${n2}_to_${n1}.txt" -num_threads ${n_threads} -max_hsps 1 -evalue 1e-6
fiif [[ "$t1" == "nucl" && "$t2" == "prot" ]]
then
echo "Running blastx from 1 to 2 and tblastn from 2 to 1"
blastx -query $tr1 -db $tr2 -outfmt 6 -out "maps/${n1}${n2}/${n1}_to_${n2}.txt" -num_threads ${n_threads} -max_hsps 1 -evalue 1e-6
tblastn -query $tr2 -db $tr1 -outfmt 6 -out "maps/${n1}${n2}/${n2}_to_${n1}.txt" -num_threads ${n_threads} -max_hsps 1 -evalue 1e-6
fiif [[ "$t1" == "prot" && "$t2" == "nucl" ]]
then
echo "Running tblastn from 1 to 2 and blastx from 2 to 1"
tblastn -query $tr1 -db $tr2 -outfmt 6 -out "maps/${n1}${n2}/${n1}_to_${n2}.txt" -num_threads ${n_threads} -max_hsps 1 -evalue 1e-6
blastx -query $tr2 -db $tr1 -outfmt 6 -out "maps/${n1}${n2}/${n2}_to_${n1}.txt" -num_threads ${n_threads} -max_hsps 1 -evalue 1e-6
fiif [[ "$t1" == "prot" && "$t2" == "prot" ]]
then
echo "Running blastp in both directions"
blastp -query $tr1 -db $tr2 -outfmt 6 -out "maps/${n1}${n2}/${n1}_to_${n2}.txt" -num_threads ${n_threads} -max_hsps 1 -evalue 1e-6
blastp -query $tr2 -db $tr1 -outfmt 6 -out "maps/${n1}${n2}/${n2}_to_${n1}.txt" -num_threads ${n_threads} -max_hsps 1 -evalue 1e-6
fi
导入环境
进行完物种比对之后就可以正式开始整合流程,首先导入所有需要的包
from samap.mapping import SAMAP
from samap.analysis import (get_mapping_scores, GenePairFinder,sankey_plot, chord_plot, CellTypeTriangles, ParalogSubstitutions, FunctionalEnrichment,convert_eggnog_to_homologs, GeneTriangles)
from samalg import SAM
import pandas as pd
import scanpy as sc
from anndata import AnnData
我们可以检查一下之前比对的结果文件是否有误
A=pd.read_csv('/data/work/BLAST/maps_out/maps/aabb/aa_to_bb.txt',sep='\t',index_col=0,header=None)
B=pd.read_csv('/data/work/BLAST/maps_out/maps/aabb/bb_to_aa.txt',sep='\t',index_col=0,header=None)
A.head()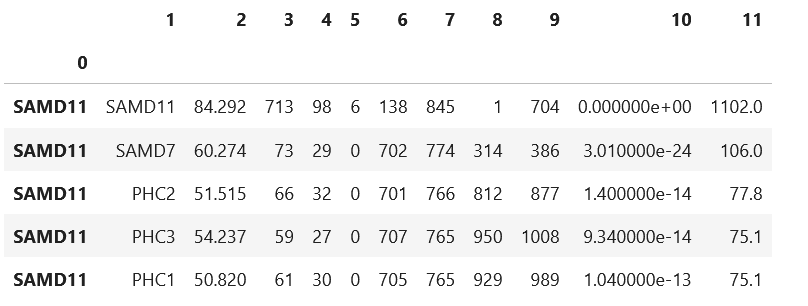
比对文件的前两列应该是对应我们单细胞/空间转录组的基因名称
构建SM对象
接下来可以导入我们单细胞或者空间转录组的分析数据,构建SAMap分析对象sm
fn1 = 'A.h5ad'
fn2 = 'B.h5ad'
fn3 = 'C.h5ad'
filenames = {'aa':fn1,'bb':fn2,'cc':fn3}
#假设比对数据路径为/data/work/BLAST/maps_out/maps/
sm = SAMAP(filenames, f_maps = '/data/work/BLAST/maps_out/maps/', save_processed=True)
整合跨物种对象
紧接着进行整合过程,日志中会描述整合的细节
sm.run(pairwise=True)
samap = sm.samap # SAM object with three species stitched together
sm.scatter()#可视化整合对象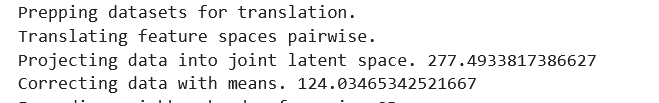
整合操作结束之后,这个sm对象里就包含了我们所需要的所有结果了
保存结果
我一般会将这里的sm对象先保存成pkl格式,下次读取使用即可
import pickle
with open('/data/work/sm_aabbcc.pkl', 'wb') as file:pickle.dump(sm, file)
print("对象已保存到本地文件。")#with open('/data/work/sm_aabbcc.pkl', 'rb') as file:
#    sm = pickle.load(file)
#print("对象已从本地文件加载。")print(dir(sm))这一步可以检查sm包含的所有数据结构,即
['ITER_DATA', '__class__', '__delattr__', '__dict__', '__dir__', '__doc__', '__eq__', '__format__', '__ge__', '__getattribute__', '__gt__', '__hash__', '__init__', '__init_subclass__', '__le__', '__lt__', '__module__', '__ne__', '__new__', '__reduce__', '__reduce_ex__', '__repr__', '__setattr__', '__sizeof__', '__str__', '__subclasshook__', '__weakref__', 'gnnm', 'gnnm_refined', 'gns', 'gns_dict', 'gui', 'ids', 'pairwise', 'plot_expression_overlap', 'query_gene_pair', 'query_gene_pairs', 'refine_homology_graph', 'run', 'run_time', 'run_umap', 'samap', 'sams', 'scatter', 'smap']
保存整合anndata及可视化
为了后续的其他分析,我们一般会提取SAMap结果的anndata格式数据
导入相关包
import scanpy as sc
import matplotlib.pyplot as plt
import networkx as nx
import umap
from scipy.sparse import csr_matrix
import seaborn as sns
import holoviews as hv
提取anndata对象
samap = sm.samap
adata = samap.adata
adata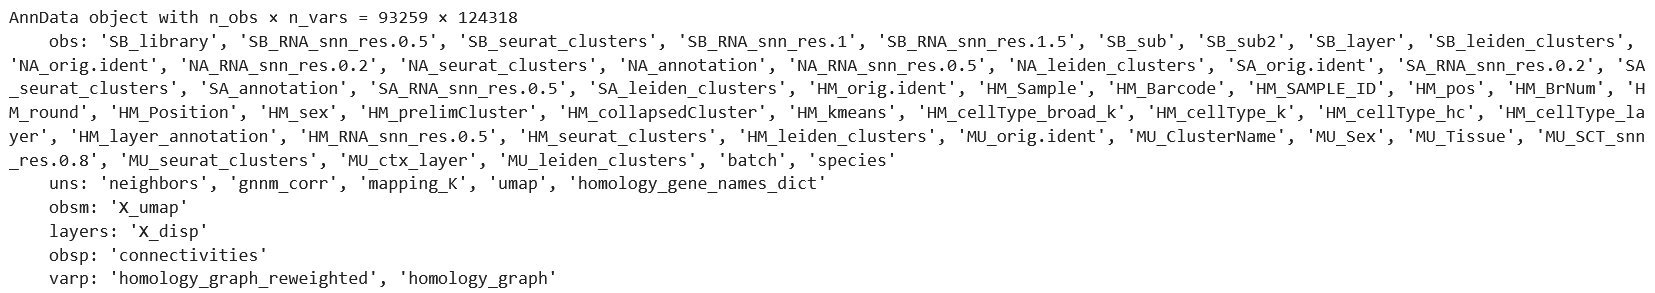
这里的adata就是我们需要的整合数据
整合UMAP可视化
sc.pl.umap(adata, color=['species'], title='UMAP projection colored by species', size=10,save='_species_projection.pdf')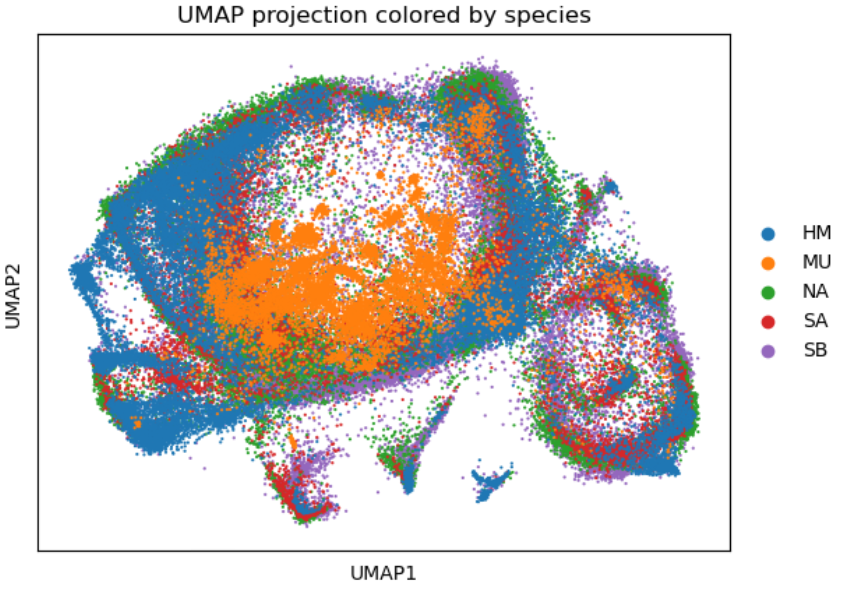
指定基因可视化
这里要注意整合数据中不同物种的对应基因要加上之前定义的缩写的前缀,“XX_gene”这样
sc.pl.umap(adata, color='SB_BDNF', title='BDNF of sb',size=5,save='_SB_BDNF_projection.pdf')
sc.pl.umap(adata, color='NA_BDNF', title='BDNF of na',size=5,save='_NA_BDNF_projection.pdf')
sc.pl.umap(adata, color='SA_BDNF', title='BDNF of sa',size=5,save='_SA_BDNF_projection.pdf')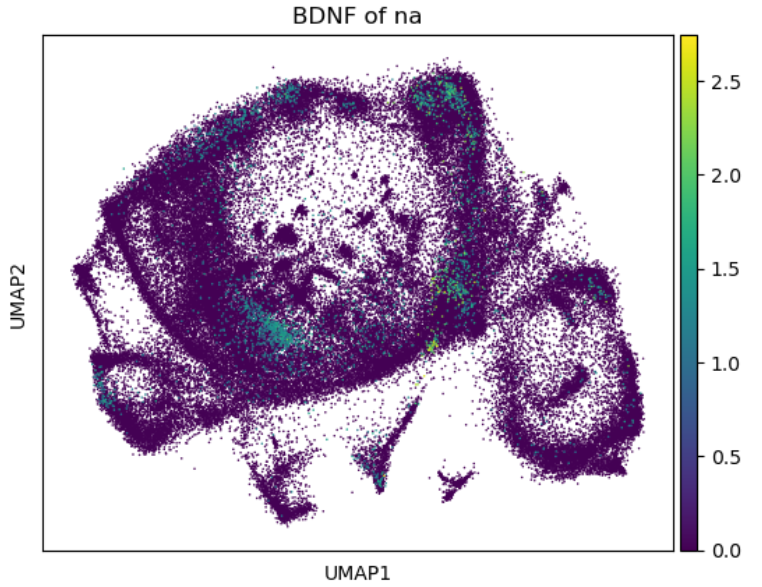
桑基图可视化
我们也可以用经典的sankeyplot表示不同物种分群之间的关系,这里的‘annotation’和‘layer’是转录组数据中的注释标签
keys = {'SB':'annotation','NA':'annotation','SA':'annotation','HM':'layer','MU':'layer'}
D,MappingTable = get_mapping_scores(sm,keys,n_top = 0)
#可视化比对表格检查
D.head()
MappingTable.head()
sankey_plot(MappingTable, align_thr=0.05, species_order=['SB', 'NA', 'SA', 'HM', 'MU'])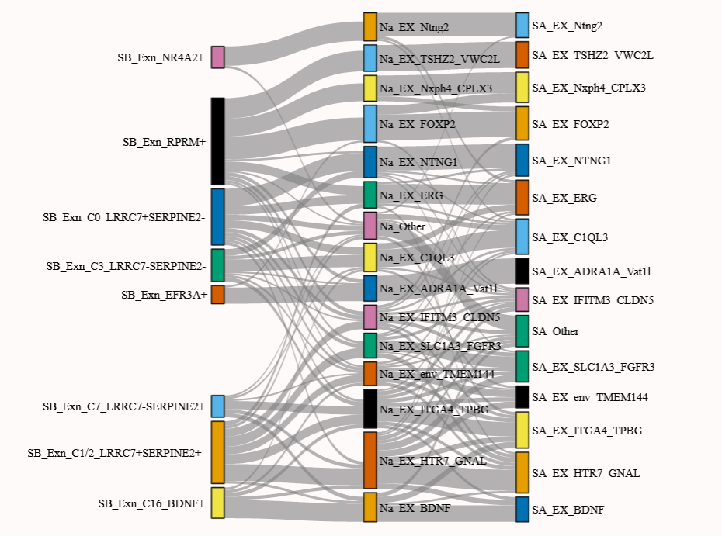
(但是这里自带的函数最多只能绘制三个物种的可视化,不知道为啥。。)
相似性热图可视化
跨物种比较最常用的就是热图可视化,这里我也利用seaborn进行了尝试
import seaborn as sns
import matplotlib.pyplot as plt# 假设 MappingTable 是一个 Pandas DataFrame,且已经包含了相似性分数
# 如果 MappingTable 是一个 NumPy 数组,也可以直接使用sns.set(style="white")# 绘制热图
plt.figure(figsize=(15, 12))  # 增大热图的尺寸
sns.heatmap(MappingTable,  # 数据源annot=True,  # 是否在热图上显示数值fmt=".2f",  # 数值的格式cmap="coolwarm",  # 色彩映射,coolwarm 是一个常见的选择linewidths=0.5,  # 单元格之间的分隔线宽度cbar_kws={"label": "Similarity Score"},  # 色标标签annot_kws={"size": 10},  # 设置注释的字体大小
)# 设置标题和标签
plt.title("Similarity Heatmap between Clusters", fontsize=18)  # 增大标题字体大小
plt.xlabel("Clusters", fontsize=16)  # 增大X轴标签字体大小
plt.ylabel("Clusters", fontsize=16)  # 增大Y轴标签字体大小# 设置坐标轴刻度标签的字体大小
plt.xticks(fontsize=12)
plt.yticks(fontsize=12)# 保存可视化文件
plt.savefig("/data/work/figures/samap_heatmap.pdf", format="pdf", bbox_inches="tight")
plt.savefig("/data/work/figures/samap_heatmap.png", format="png", bbox_inches="tight")# 显示热图
plt.show()