docker安装Prometheus+Grafana
docker 安装Prometheus
下载镜像
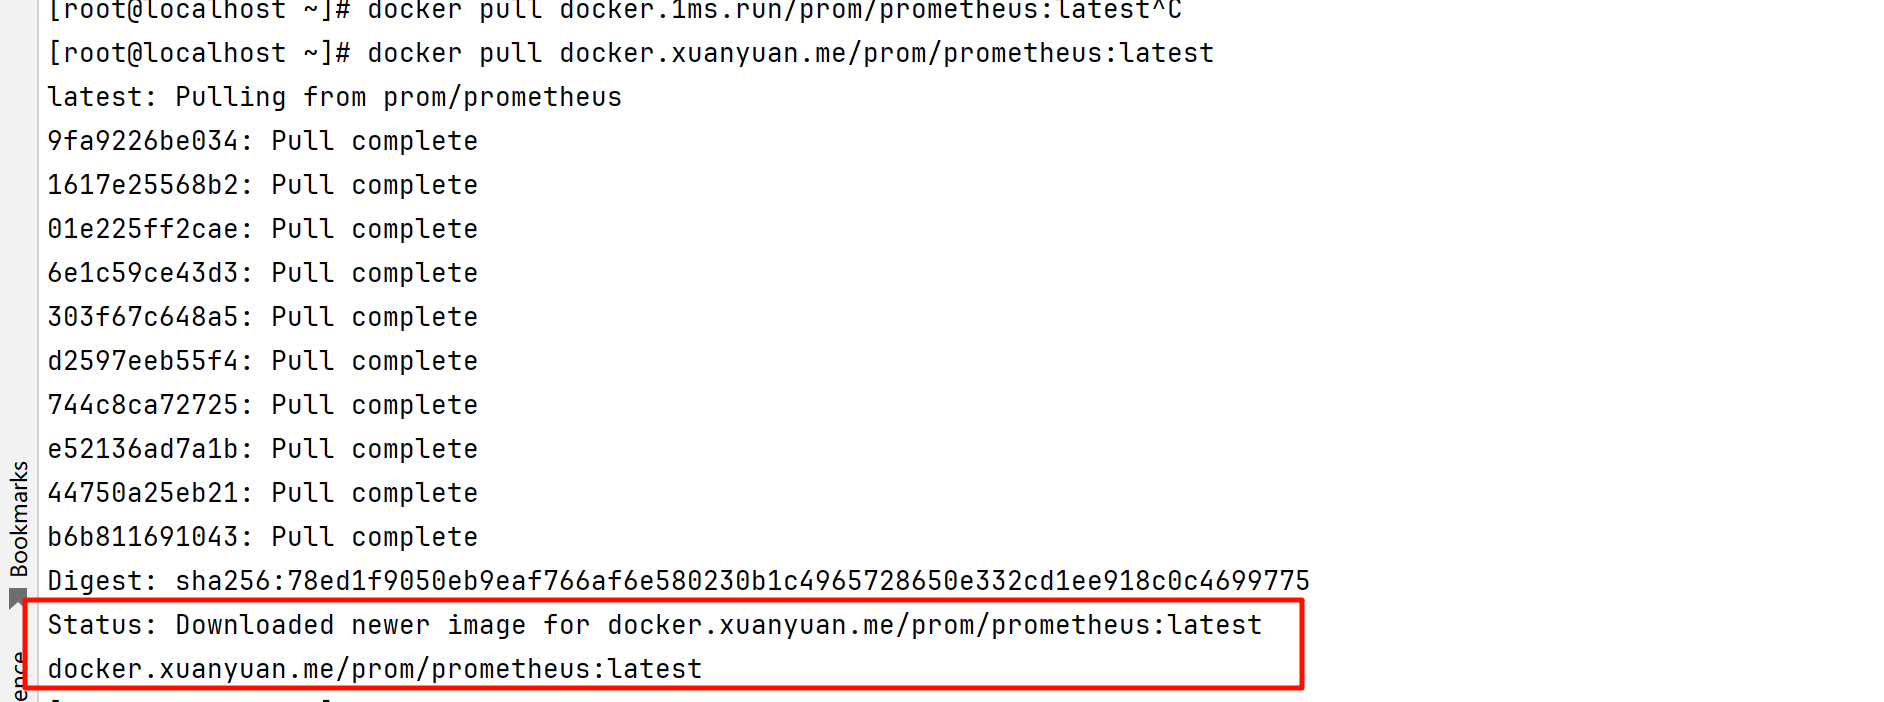
很多镜像服务器都不行了,我用的这个地址还可以
查看可用docker镜像地址:https://cloud.tencent.com/developer/article/2485043
docker pull docker.xuanyuan.me/prom/prometheus:latest
启动
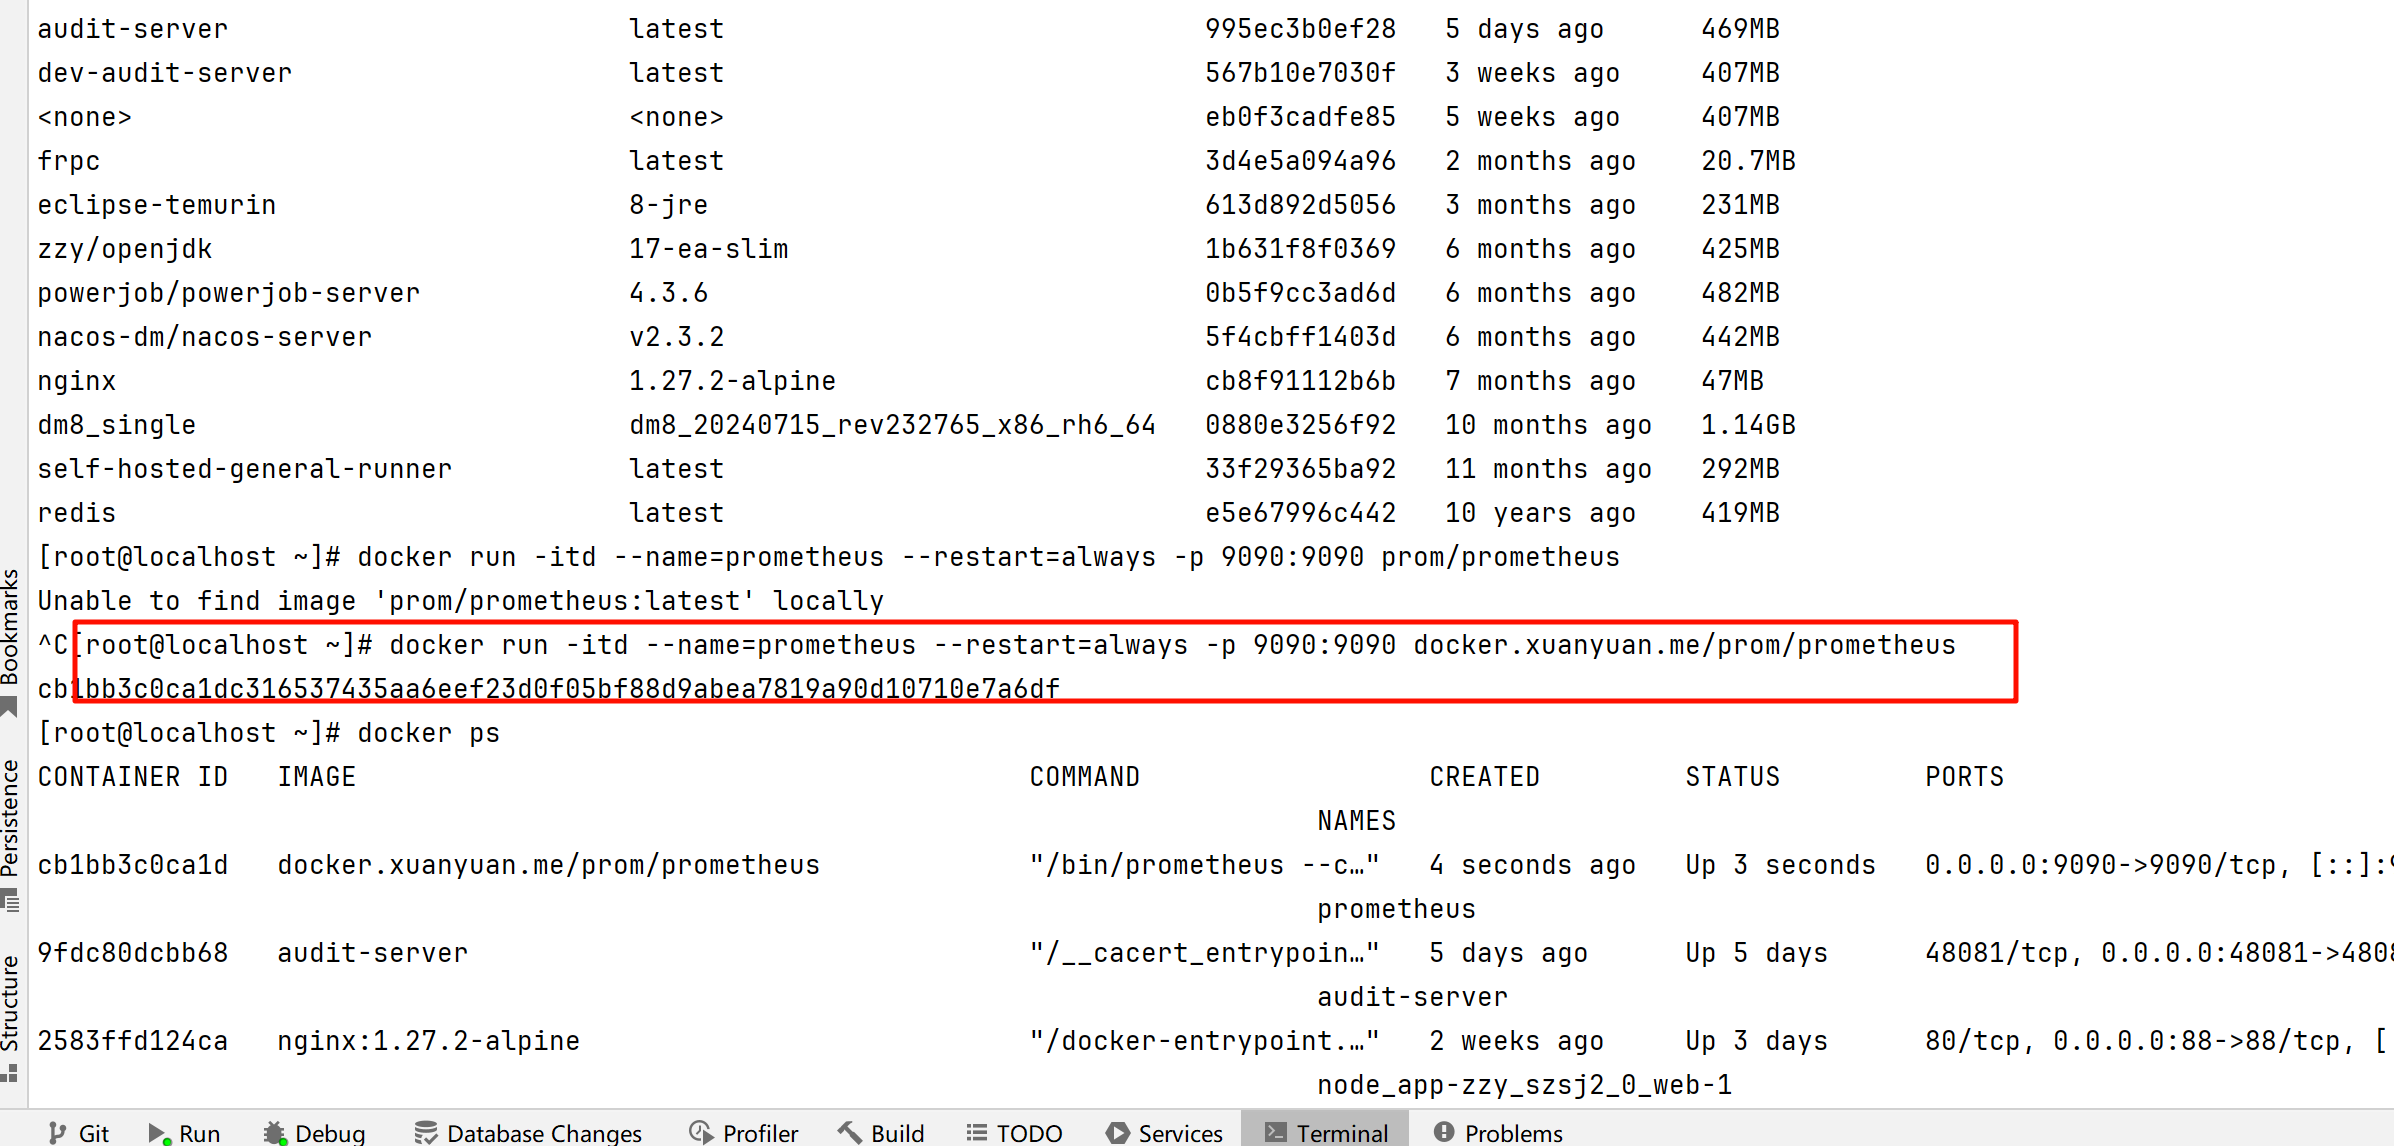
docker run -itd --name=prometheus --restart=always -p 9090:9090 docker.xuanyuan.me/prom/prometheus
访问
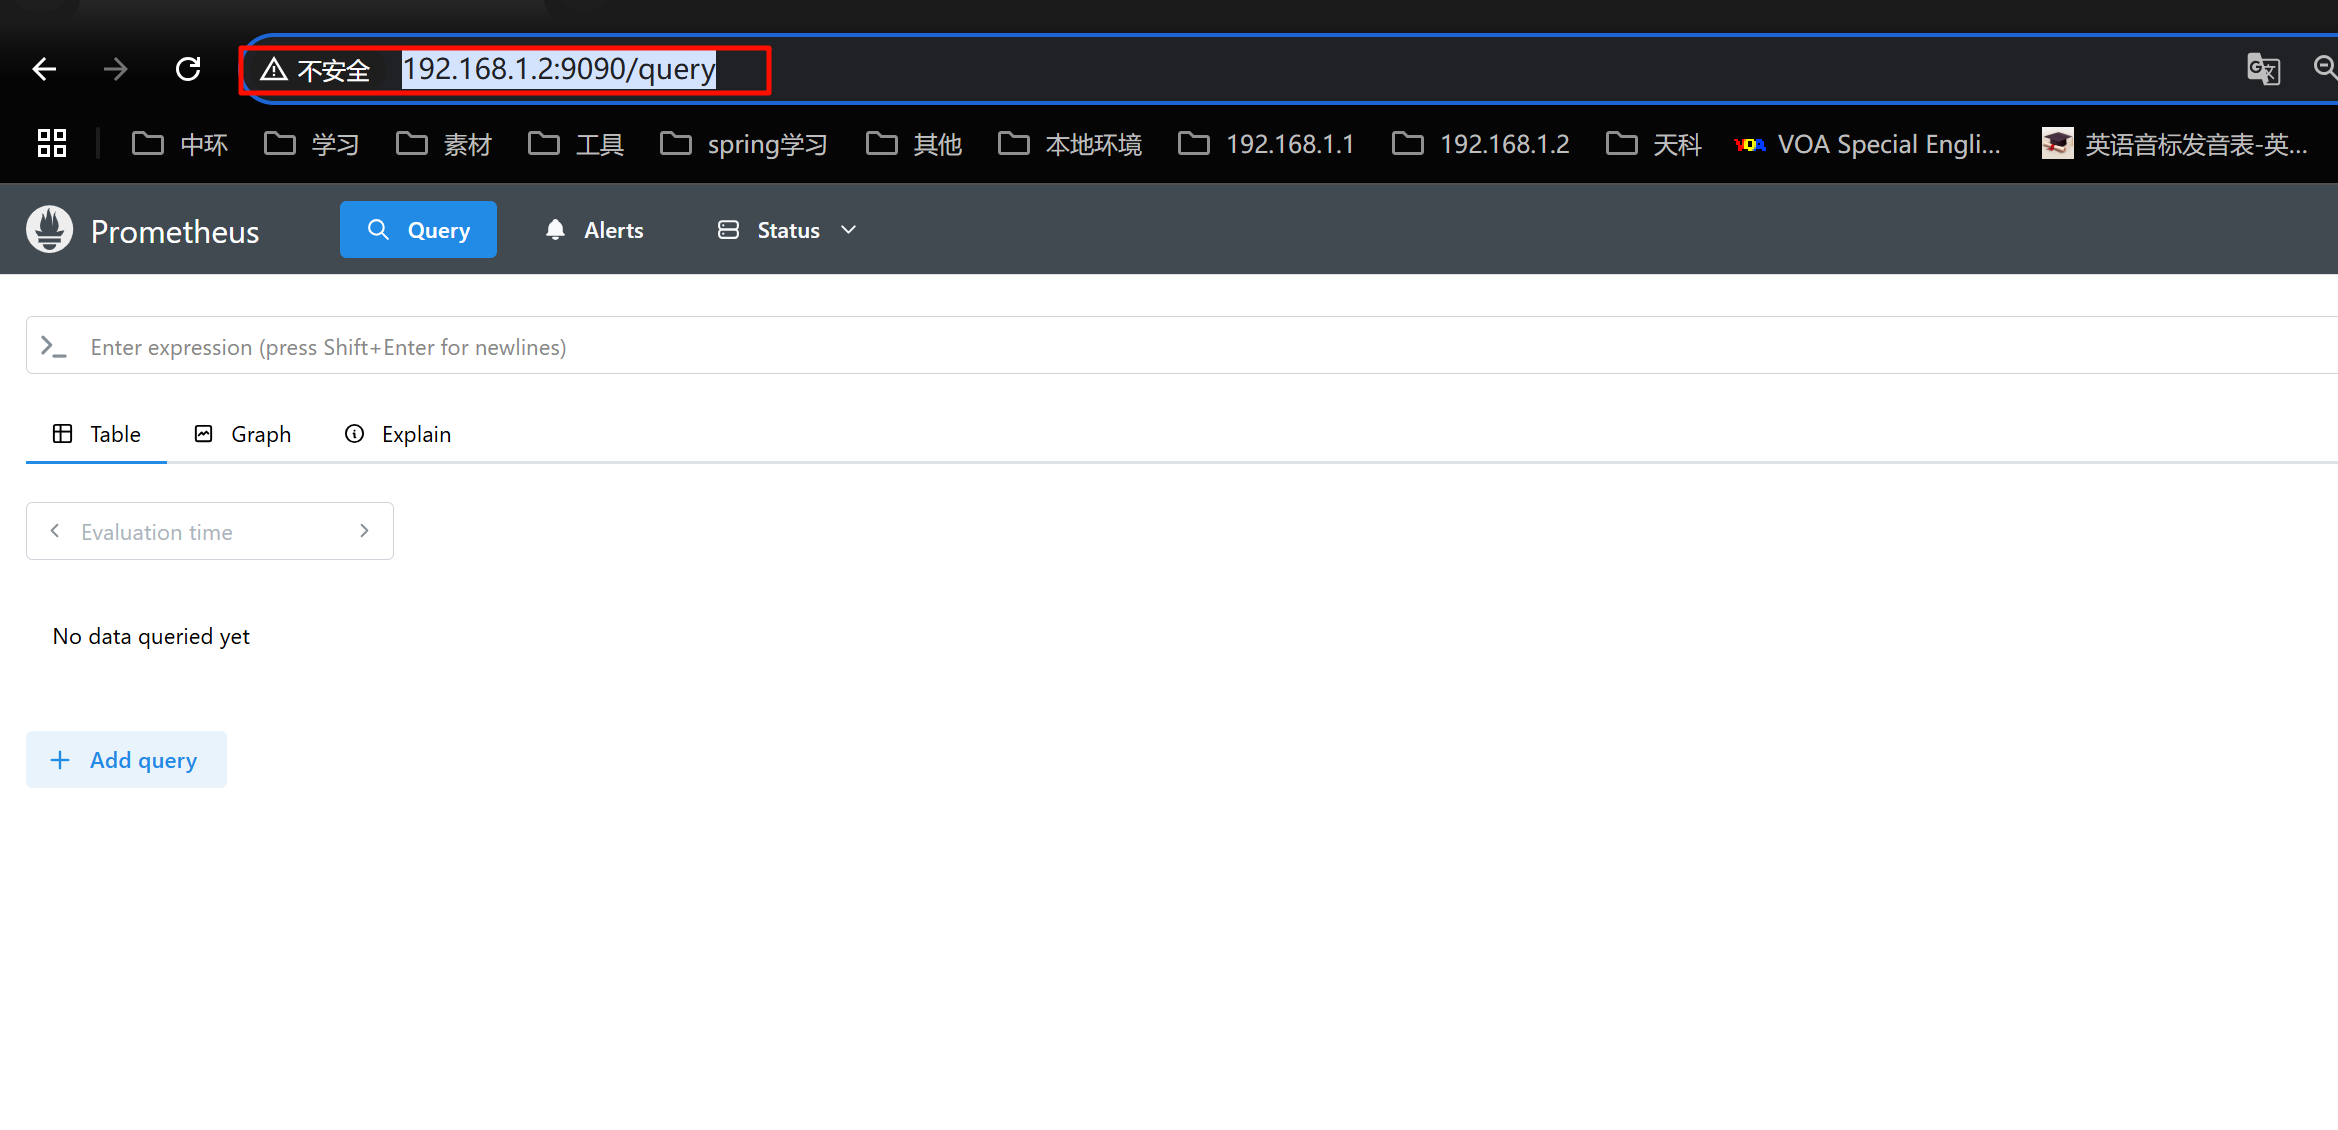
服务地址:
http://192.168.1.2:9090/query
192.168.1.2为服务器ip
安装Node_exporter
下载镜像
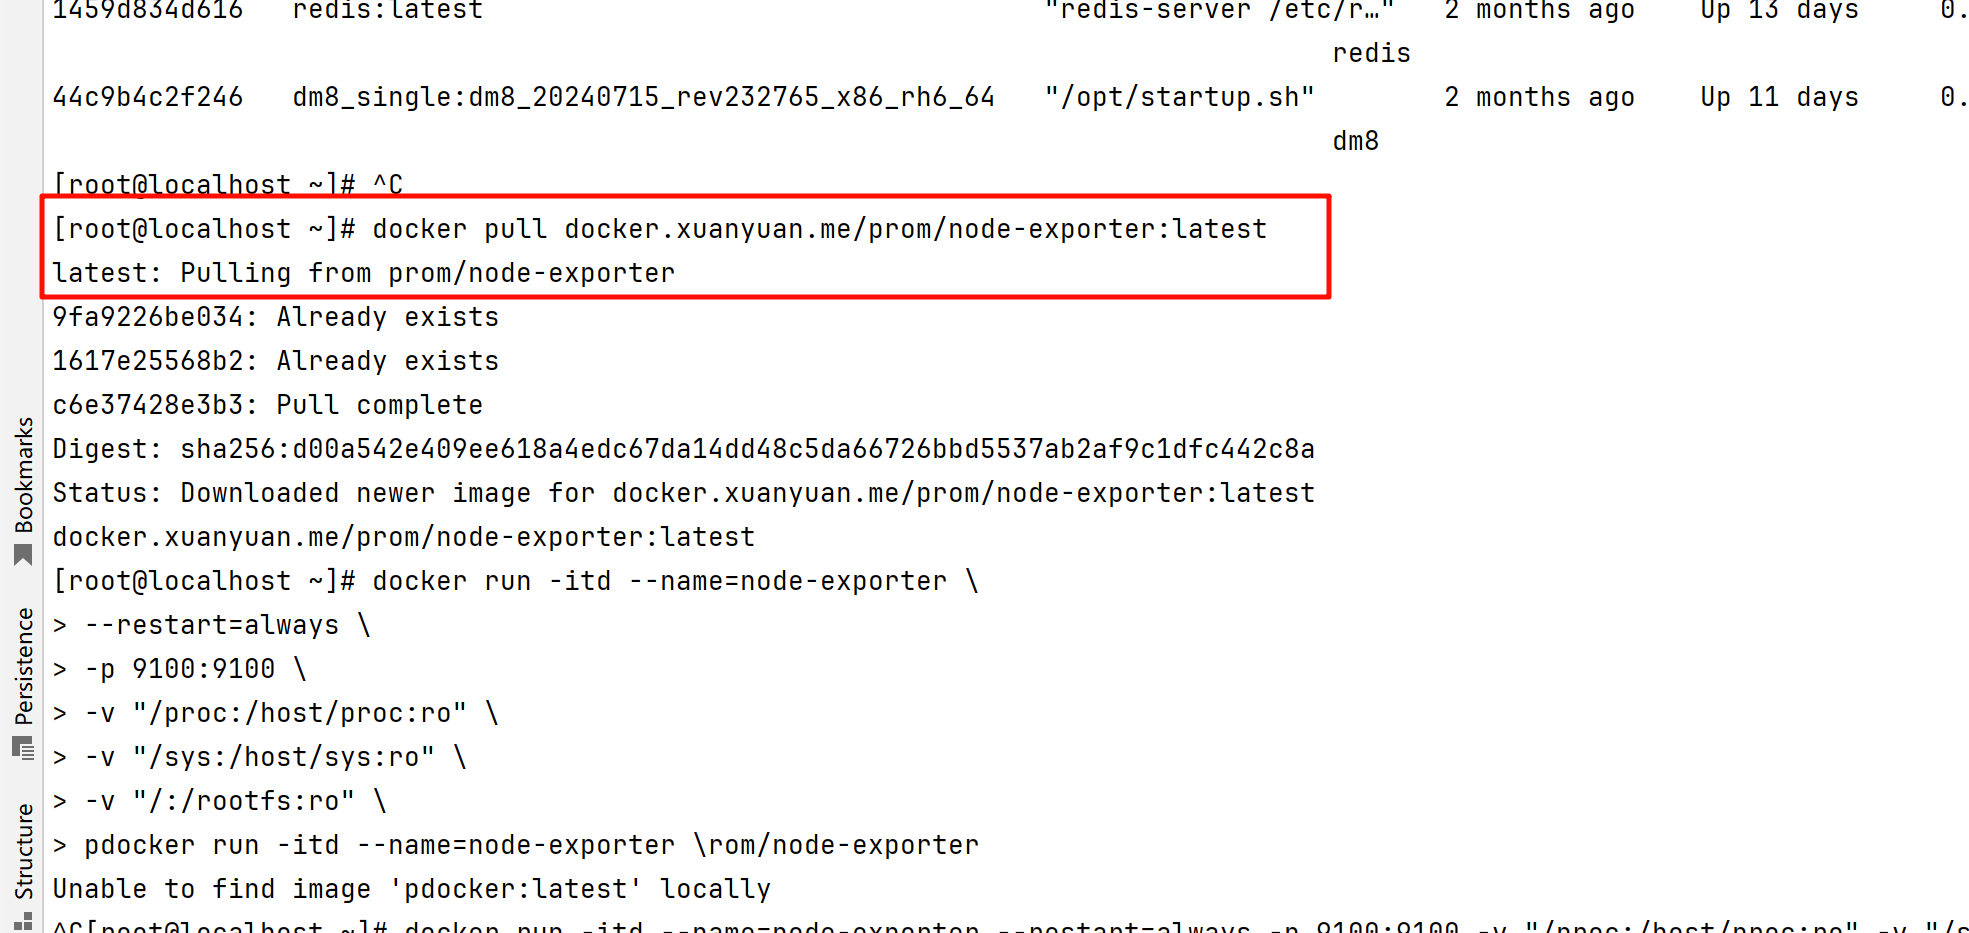
docker pull docker.xuanyuan.me/prom/node-exporter:latest
启动
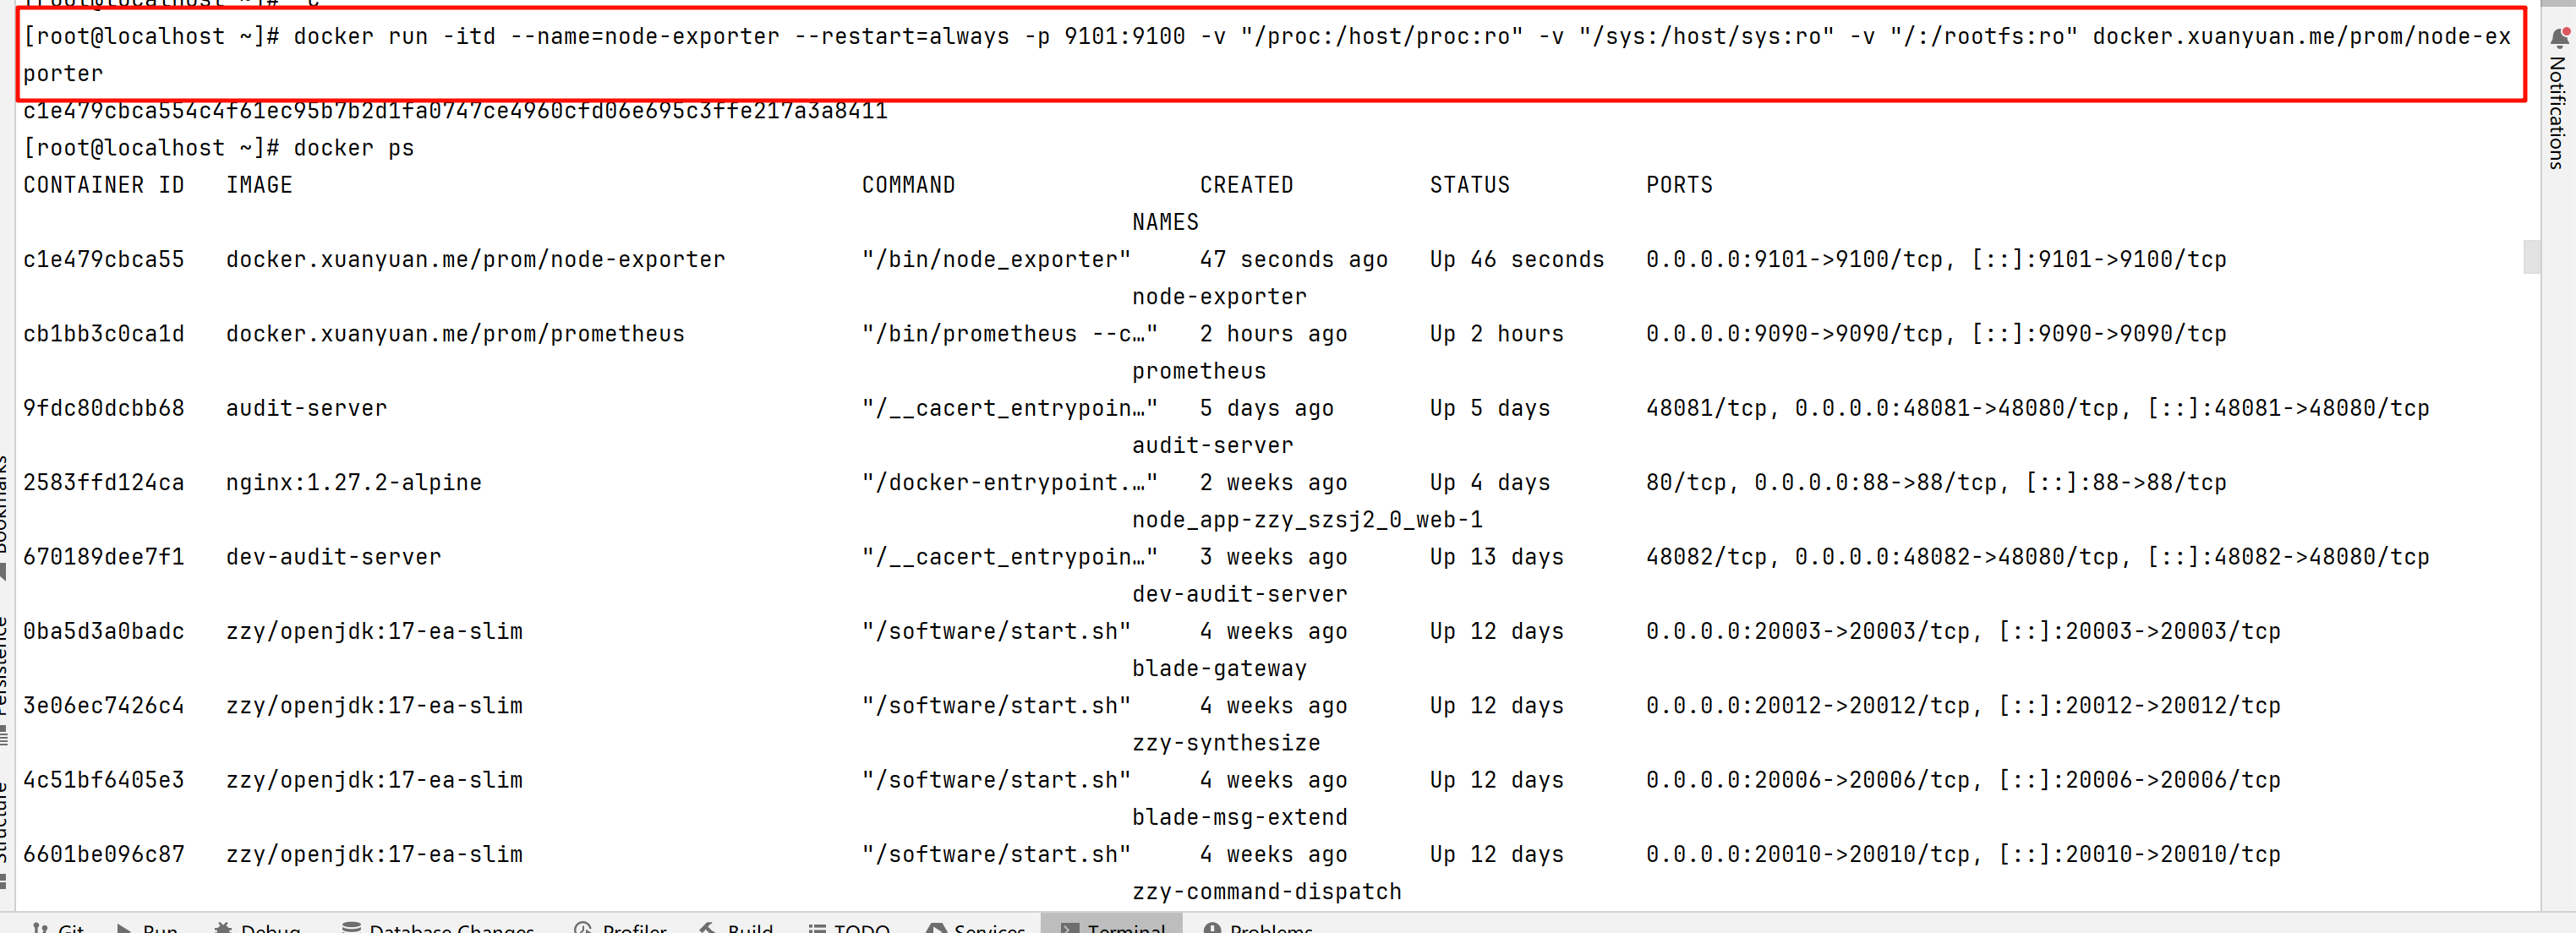
docker run -itd --name=node-exporter --restart=always -p 9101:9100 -v "/proc:/host/proc:ro" -v "/sys:/host/sys:ro" -v "/:/rootfs:ro" docker.xuanyuan.me/prom/node-exporter
访问
访问地址
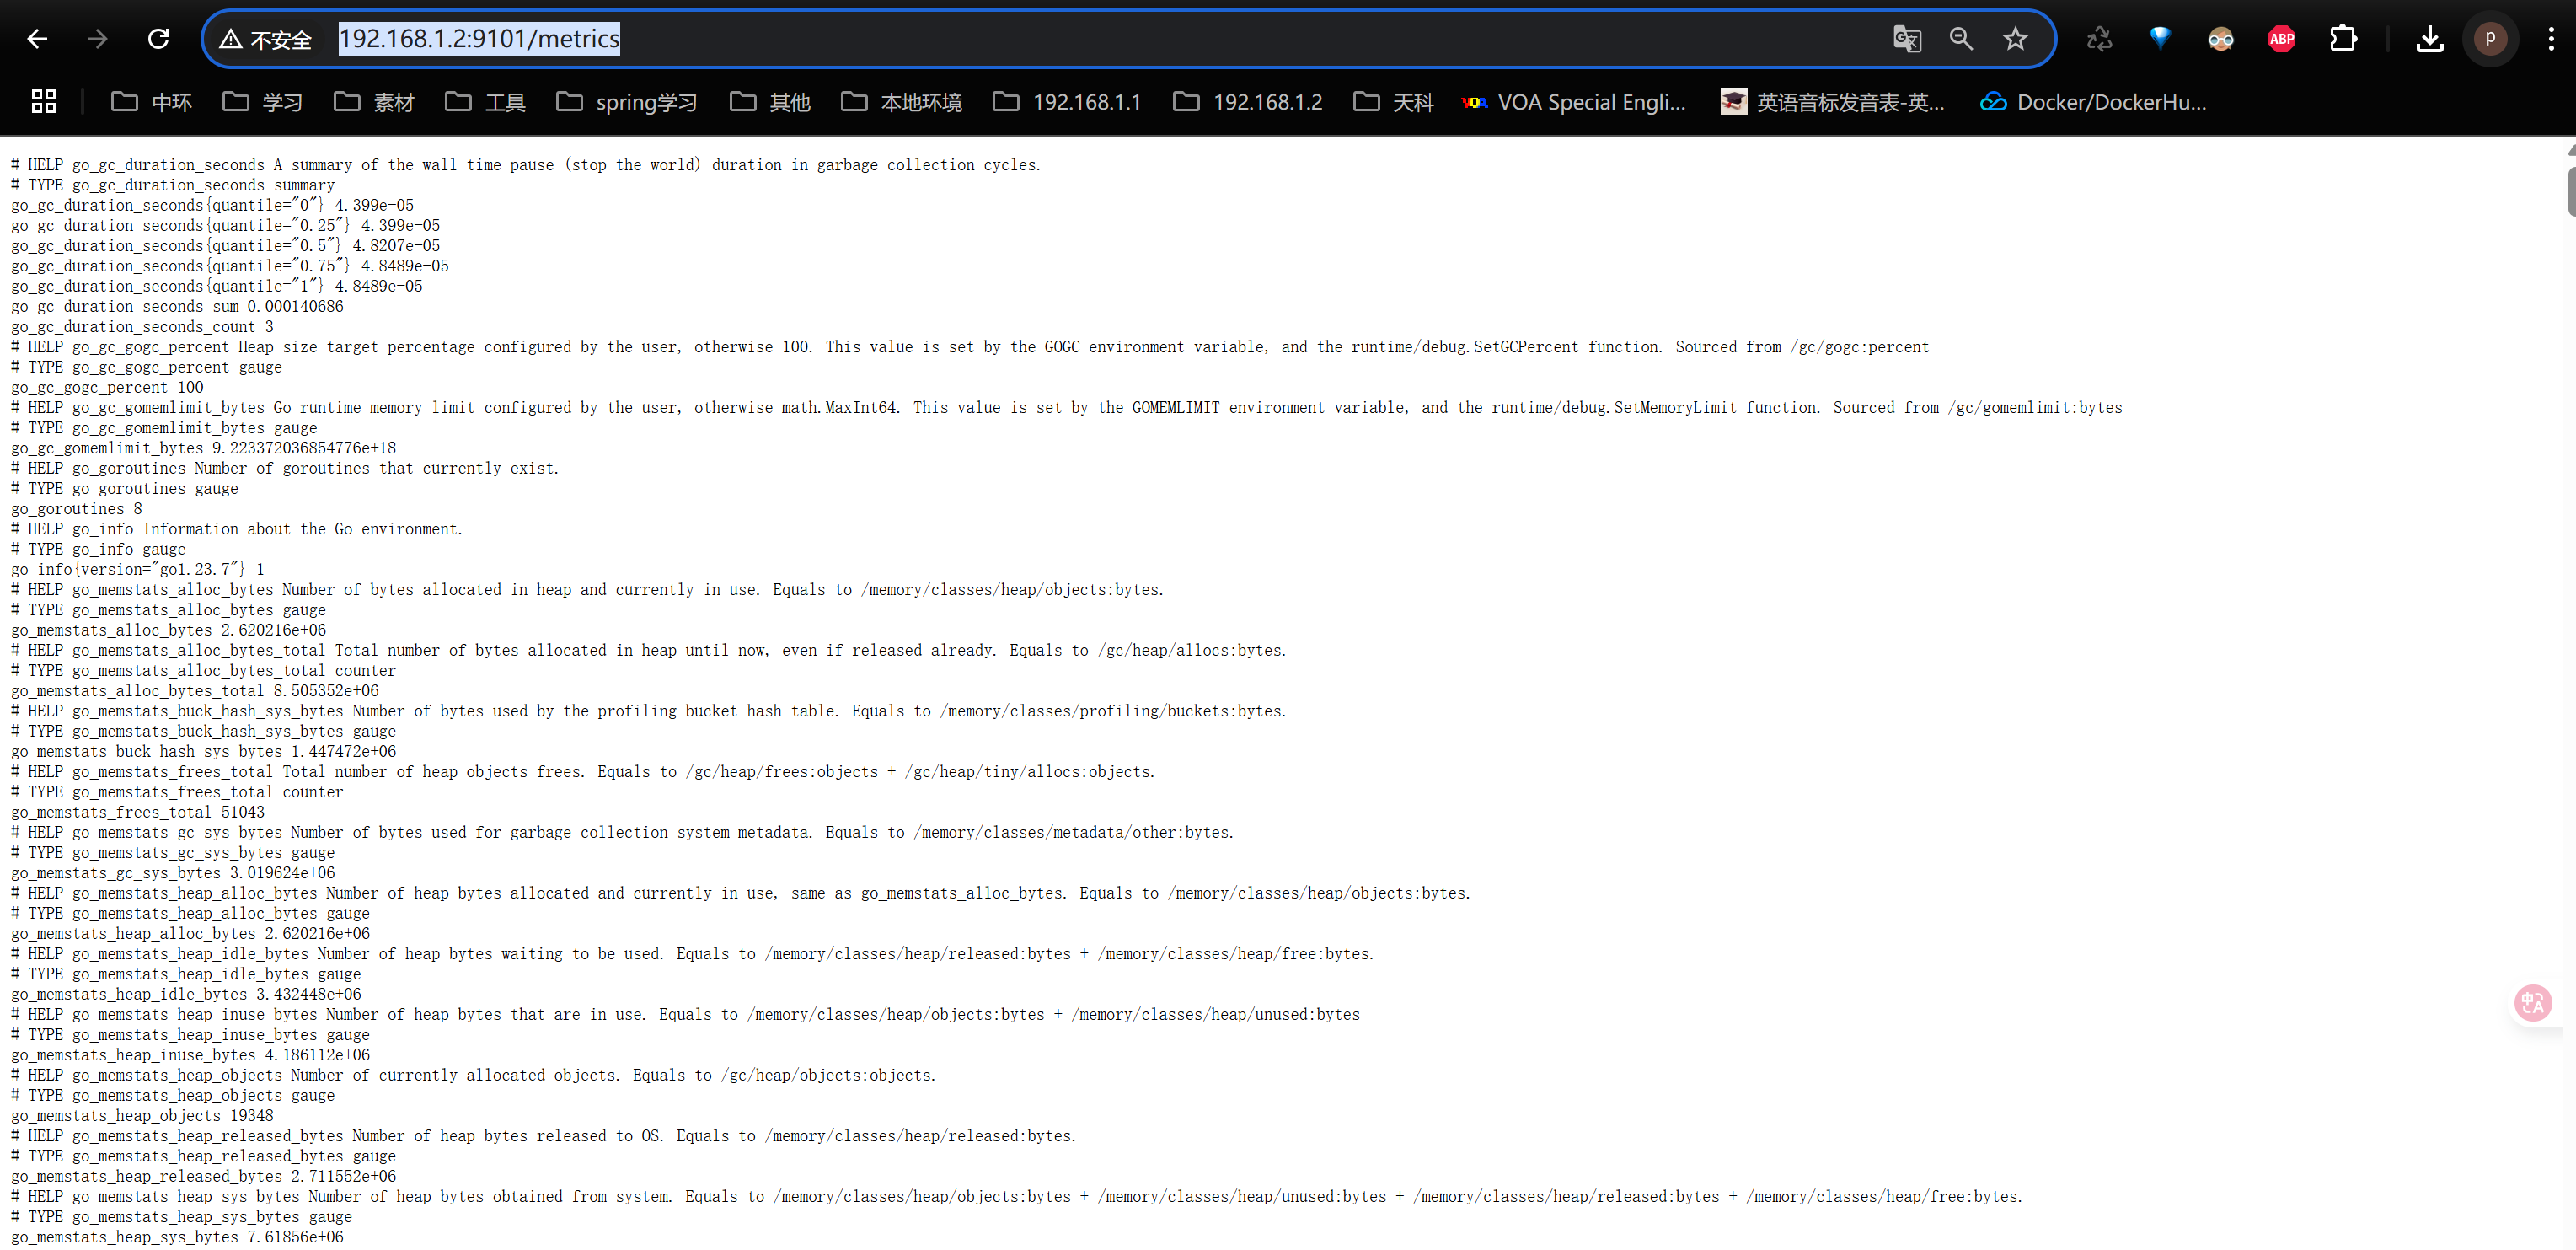
http://192.168.1.2:9101/metrics
192.168.1.2为服务器ip
9101为端口,默认端口是9100,我是端口被占改了一下
配置Prometheus
把容器内配置文件拷贝出来
docker cp prometheus:/etc/prometheus/prometheus.yml $PWD
编辑
vim prometheus.yml
内容
# my global config
global:scrape_interval: 15s # Set the scrape interval to every 15 seconds. Default is every 1 minute.evaluation_interval: 15s # Evaluate rules every 15 seconds. The default is every 1 minute.# scrape_timeout is set to the global default (10s).# Alertmanager configuration
alerting:alertmanagers:- static_configs:- targets:# - alertmanager:9093# Load rules once and periodically evaluate them according to the global 'evaluation_interval'.
rule_files:# - "first_rules.yml"# - "second_rules.yml"# A scrape configuration containing exactly one endpoint to scrape:
# Here it's Prometheus itself.
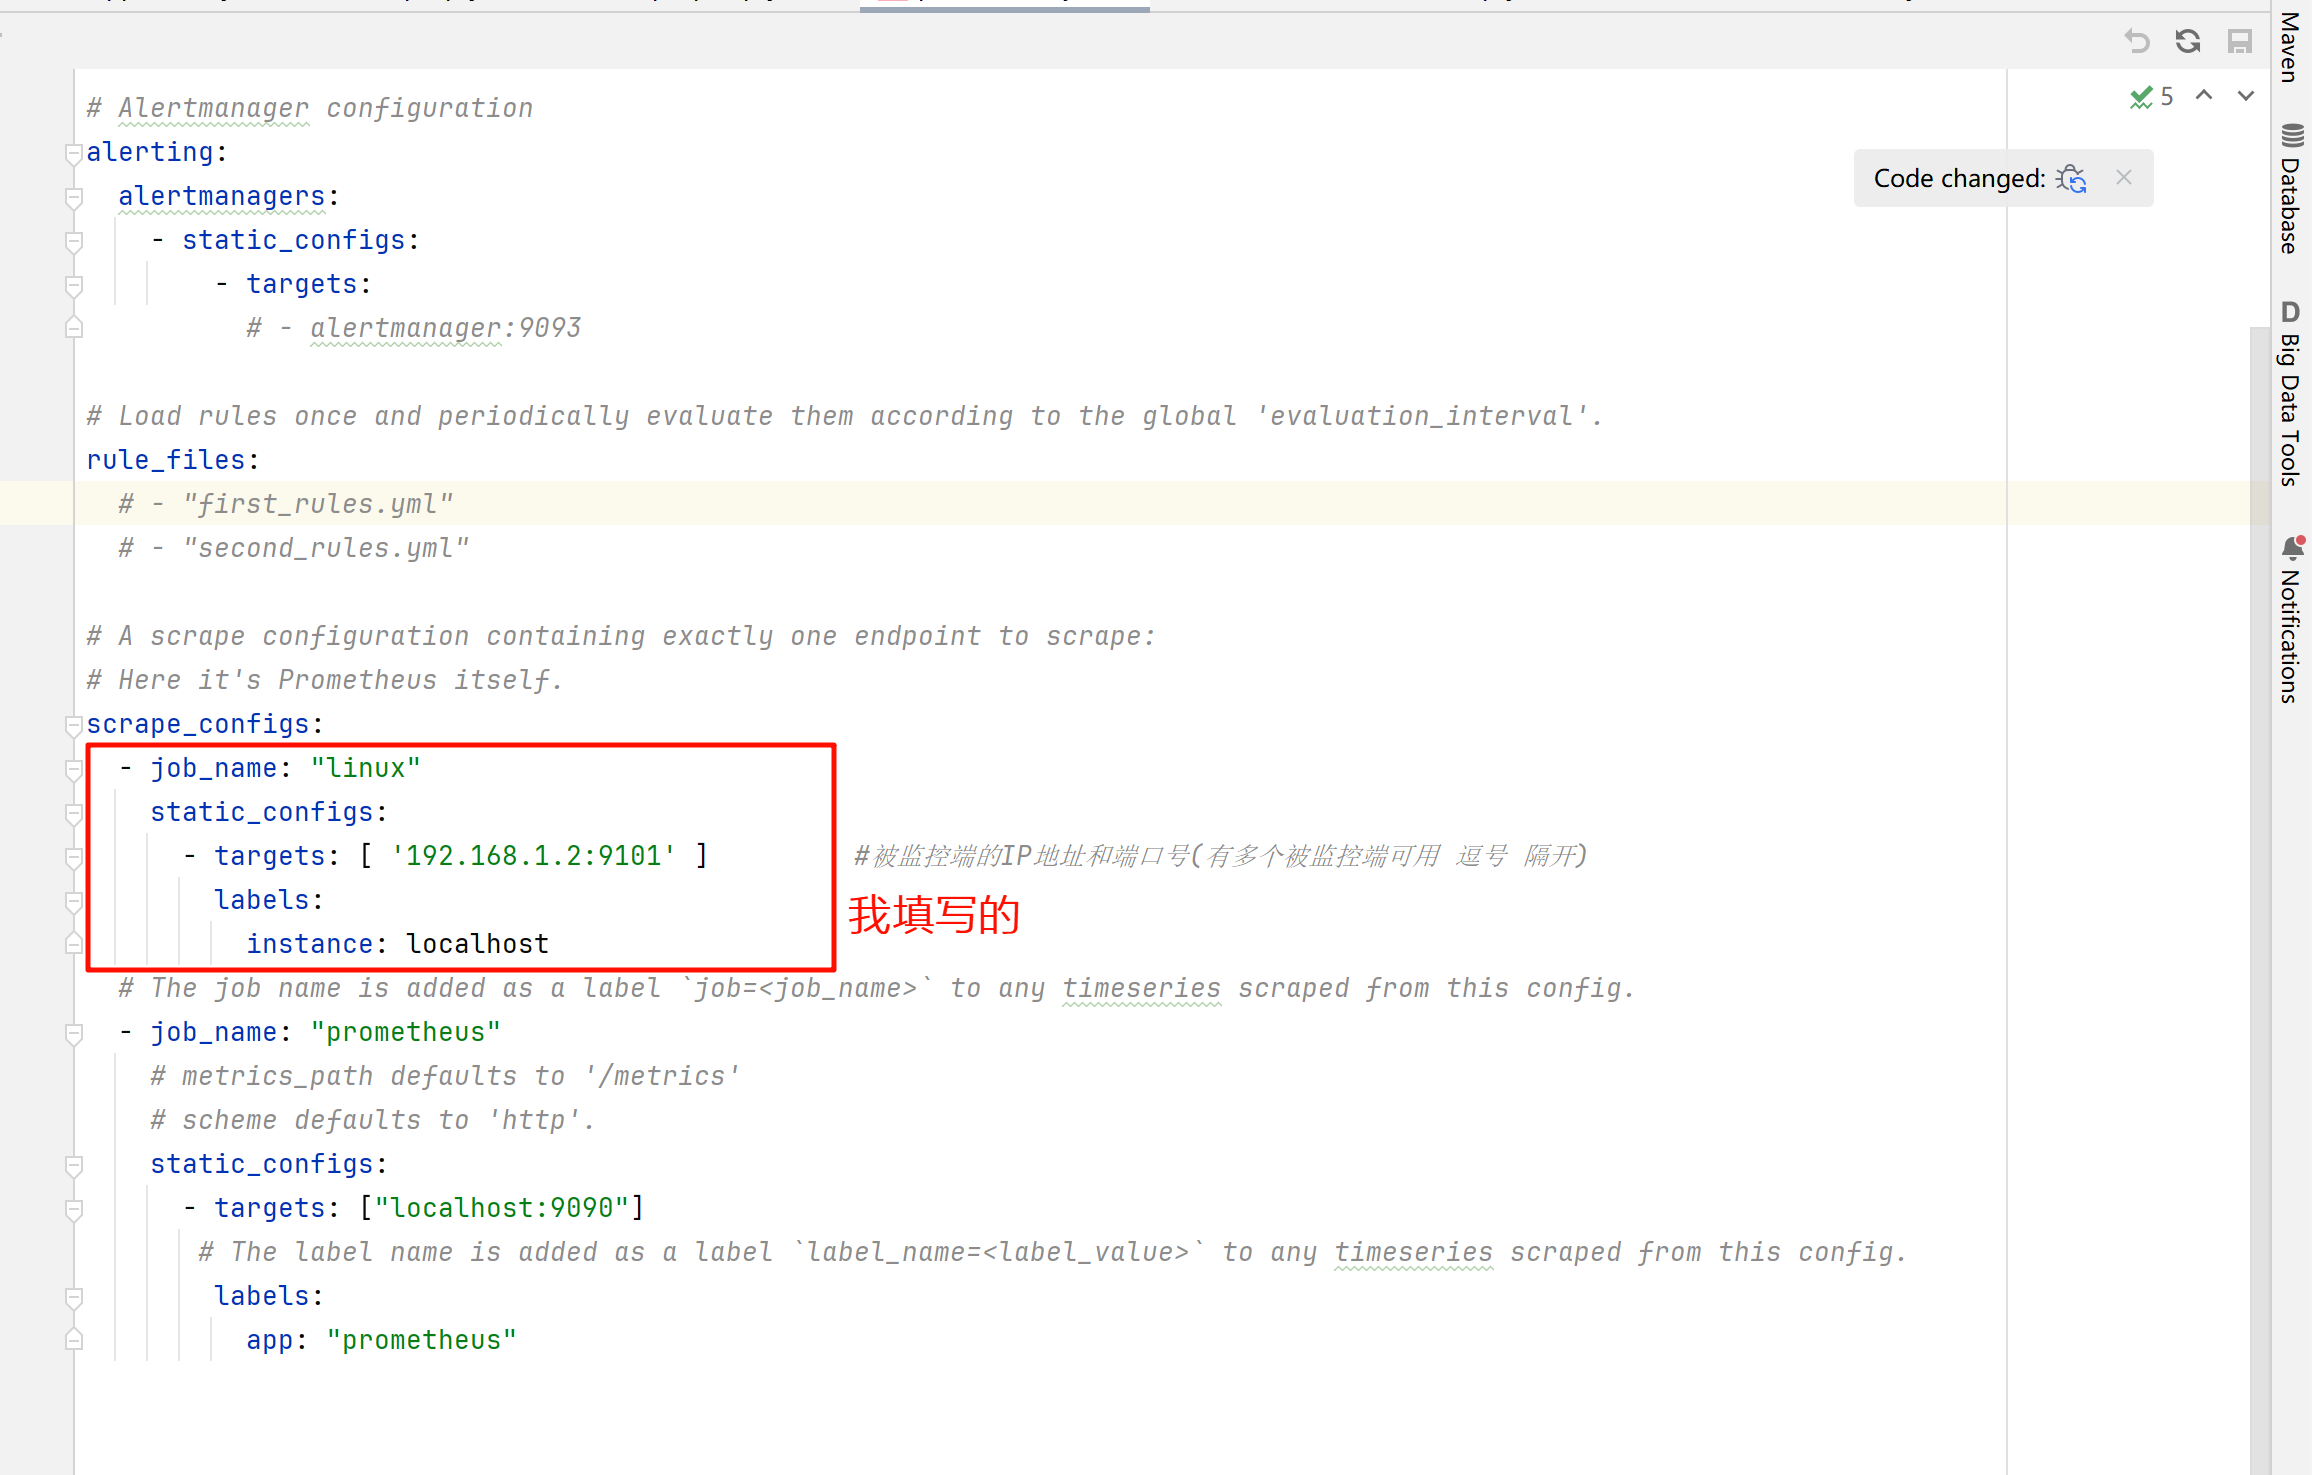
scrape_configs:- job_name: "linux"static_configs:- targets: [ '192.168.1.2:9101' ] #被监控端的IP地址和端口号(有多个被监控端可用 逗号 隔开)labels:instance: localhost# The job name is added as a label `job=<job_name>` to any timeseries scraped from this config.- job_name: "prometheus"# metrics_path defaults to '/metrics'# scheme defaults to 'http'.static_configs:- targets: ["localhost:9090"]# The label name is added as a label `label_name=<label_value>` to any timeseries scraped from this config.labels:app: "prometheus"
保存配置文件到容器
docker cp $PWD/prometheus.yml prometheus:/etc/prometheus/prometheus.yml
重启容器
docker restart prometheus
安装Grafana
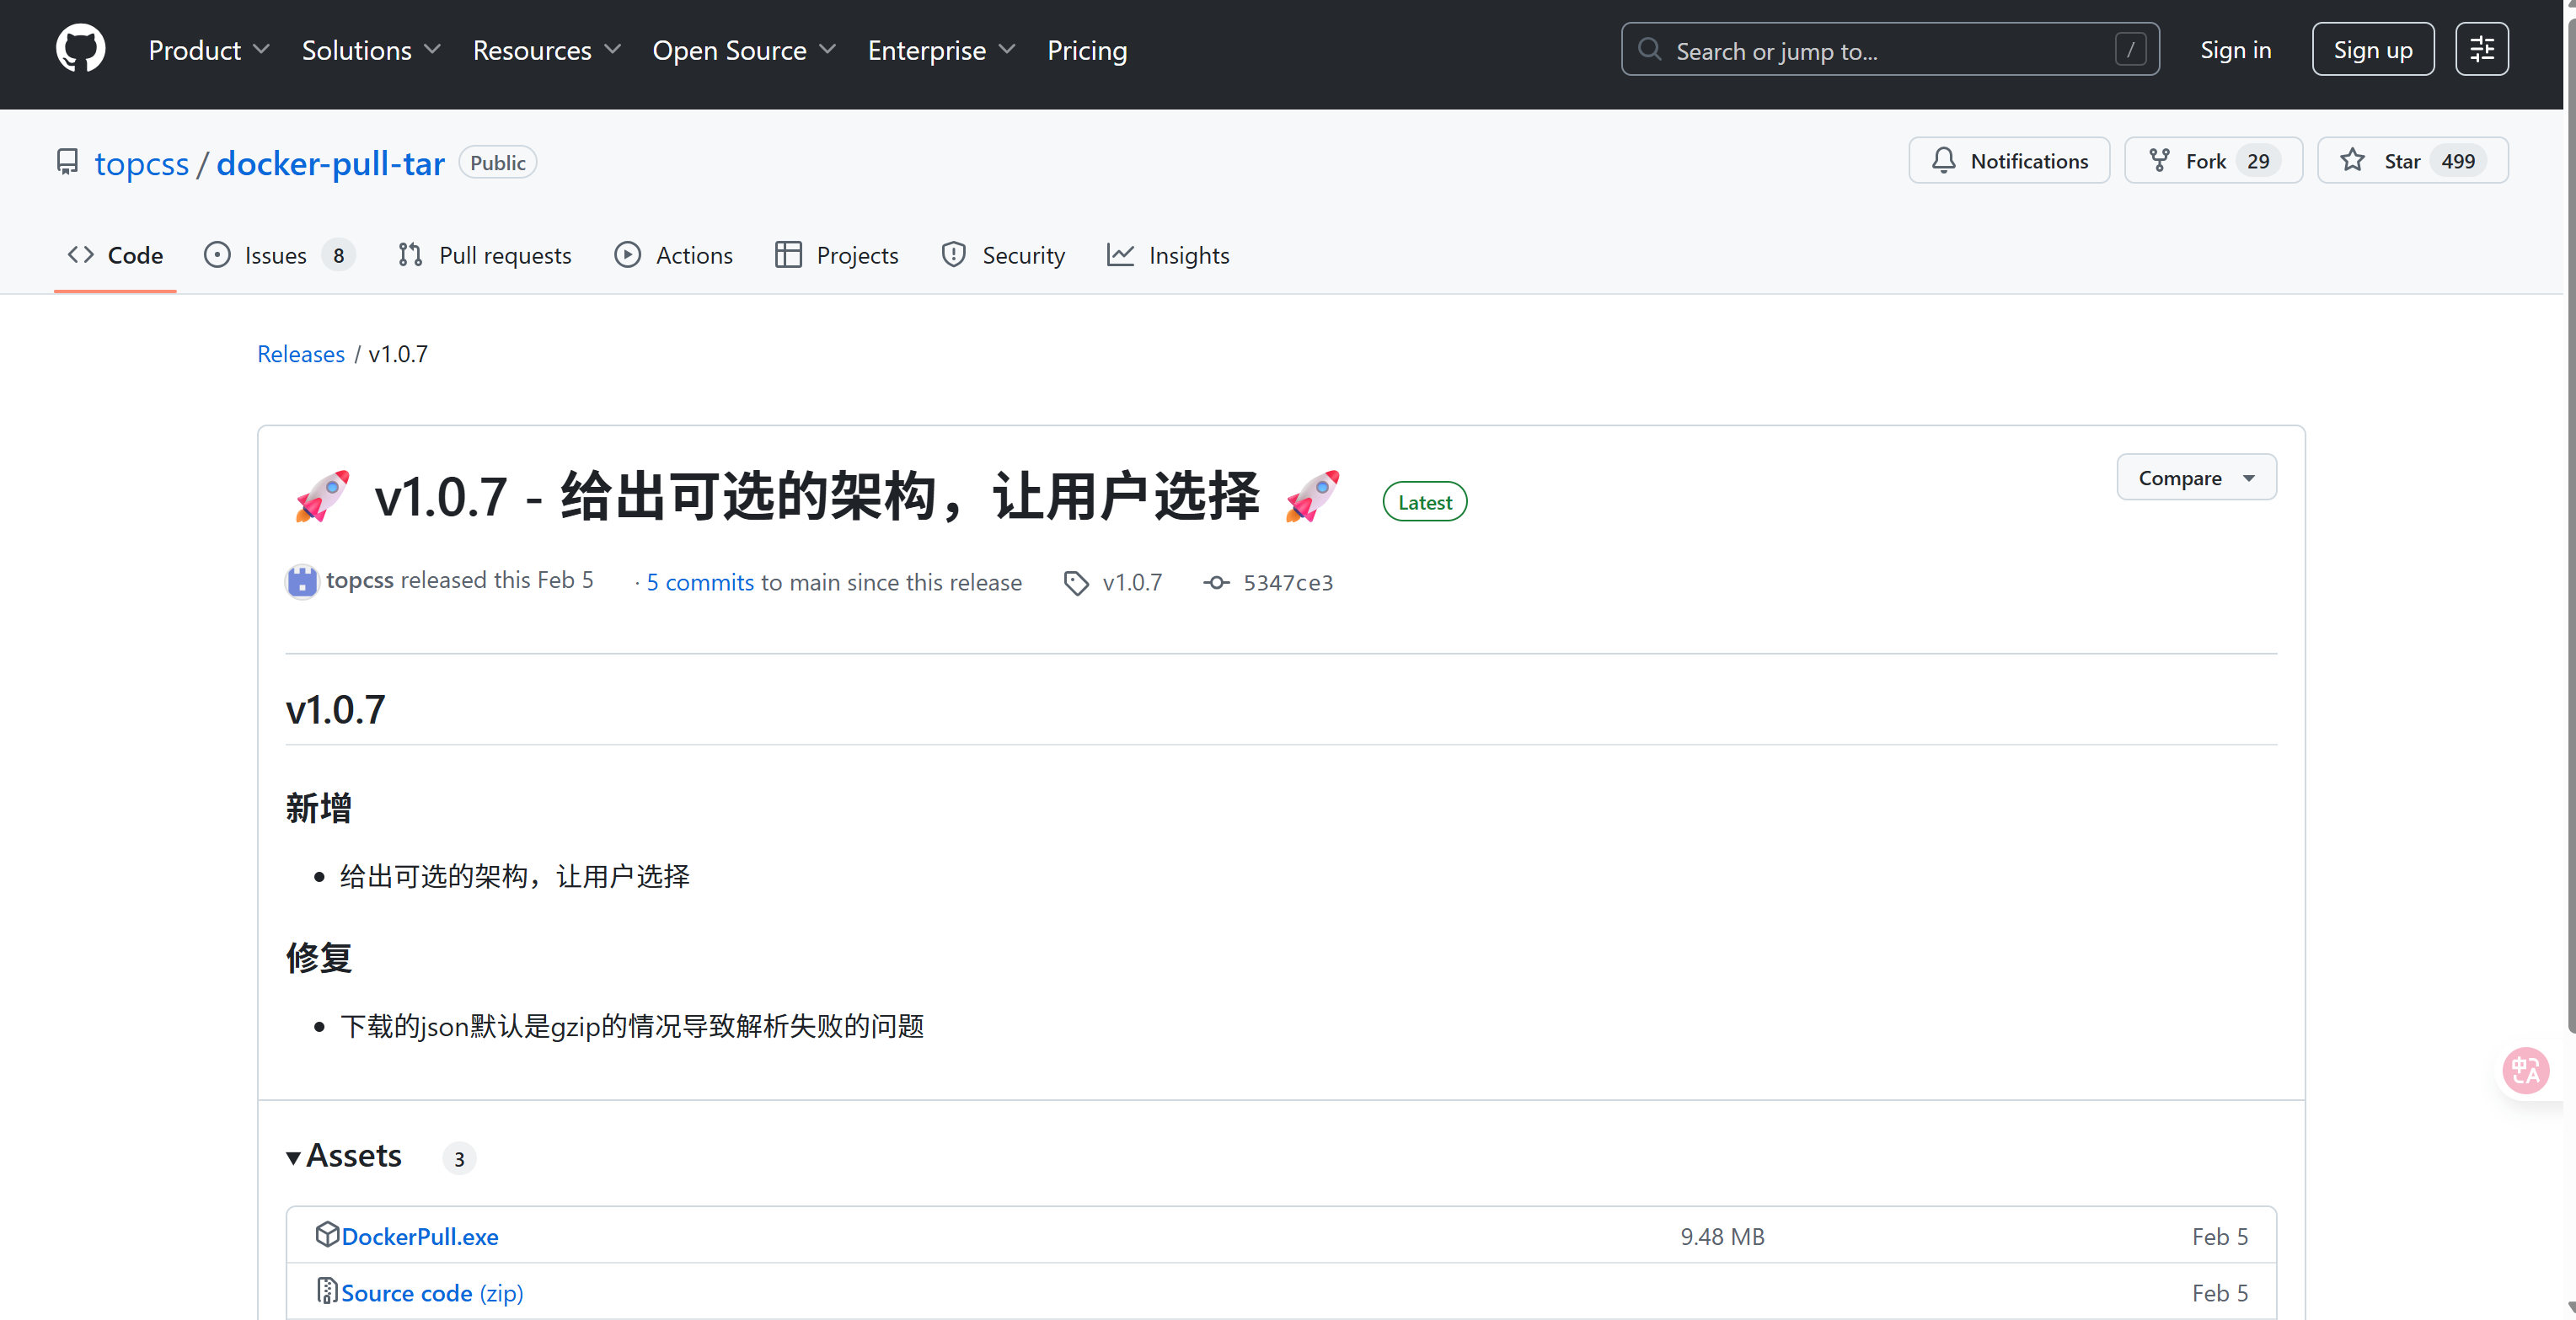
安装Grafana时我用上面的镜像地址没有下载下来,我用的github上的一个工具,如果你们有其他方法也行。
工具地址:https://github.com/topcss/docker-pull-tar/releases/tag/v1.0.7
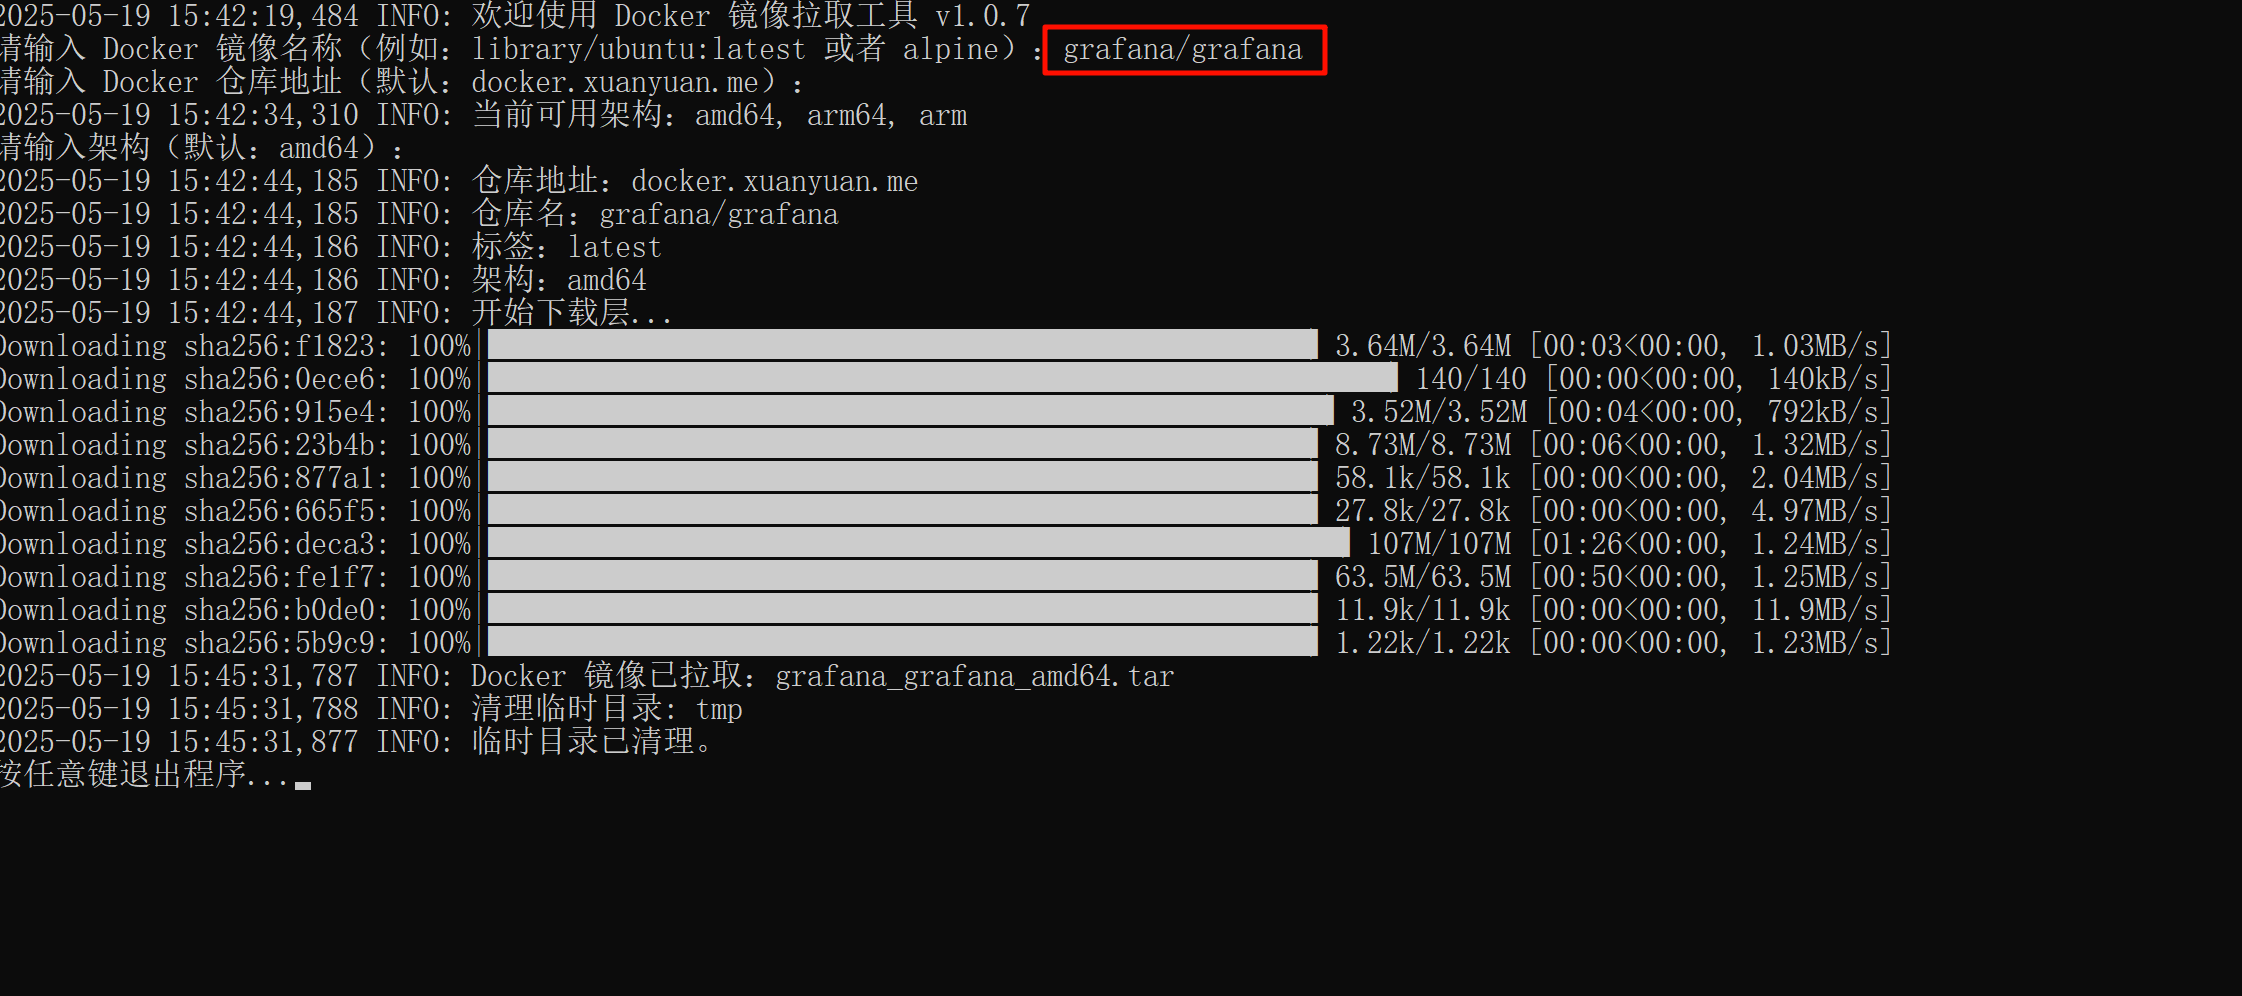
下载镜像
打开下载的工具输入
grafana/grafana
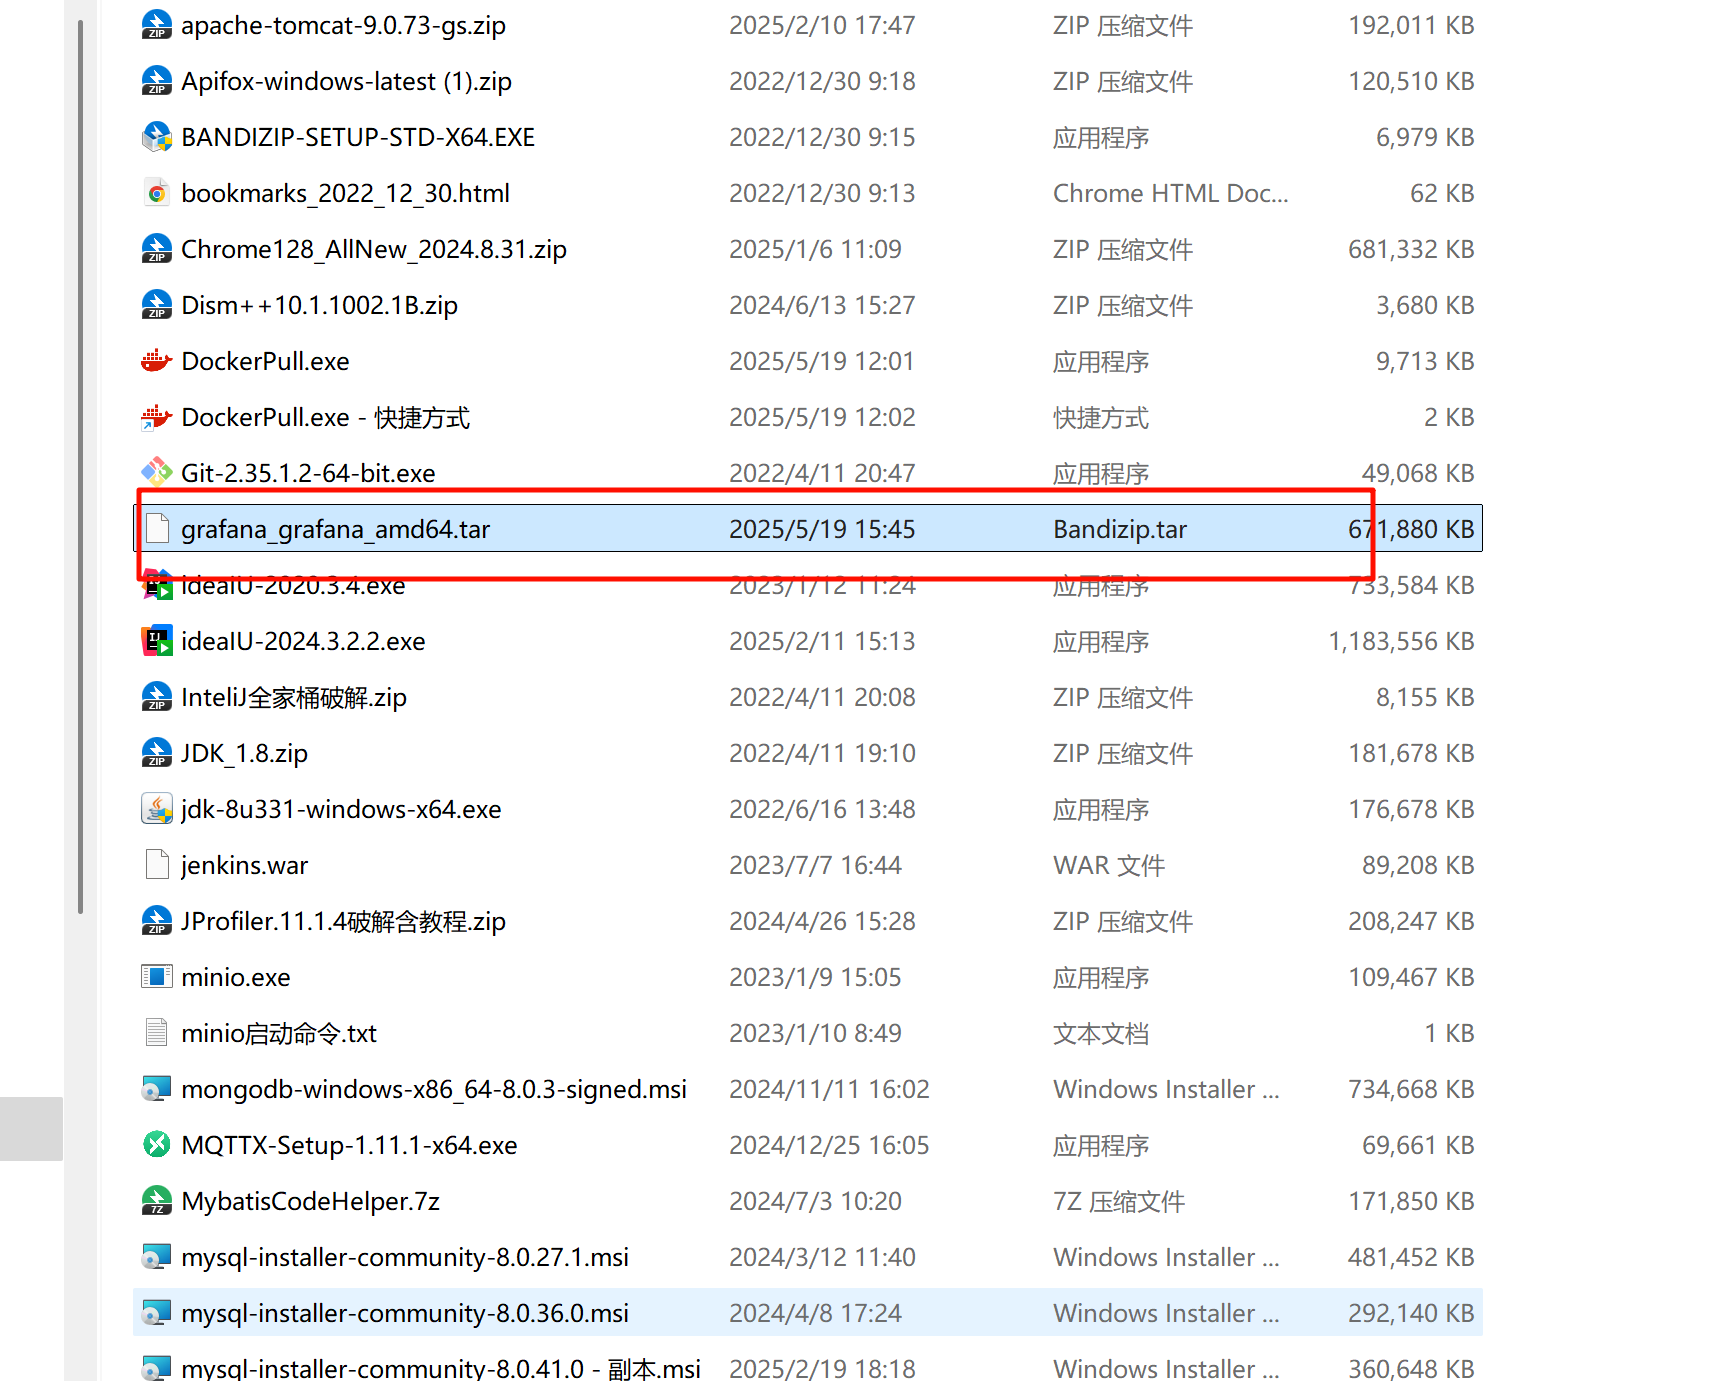
上传服务器
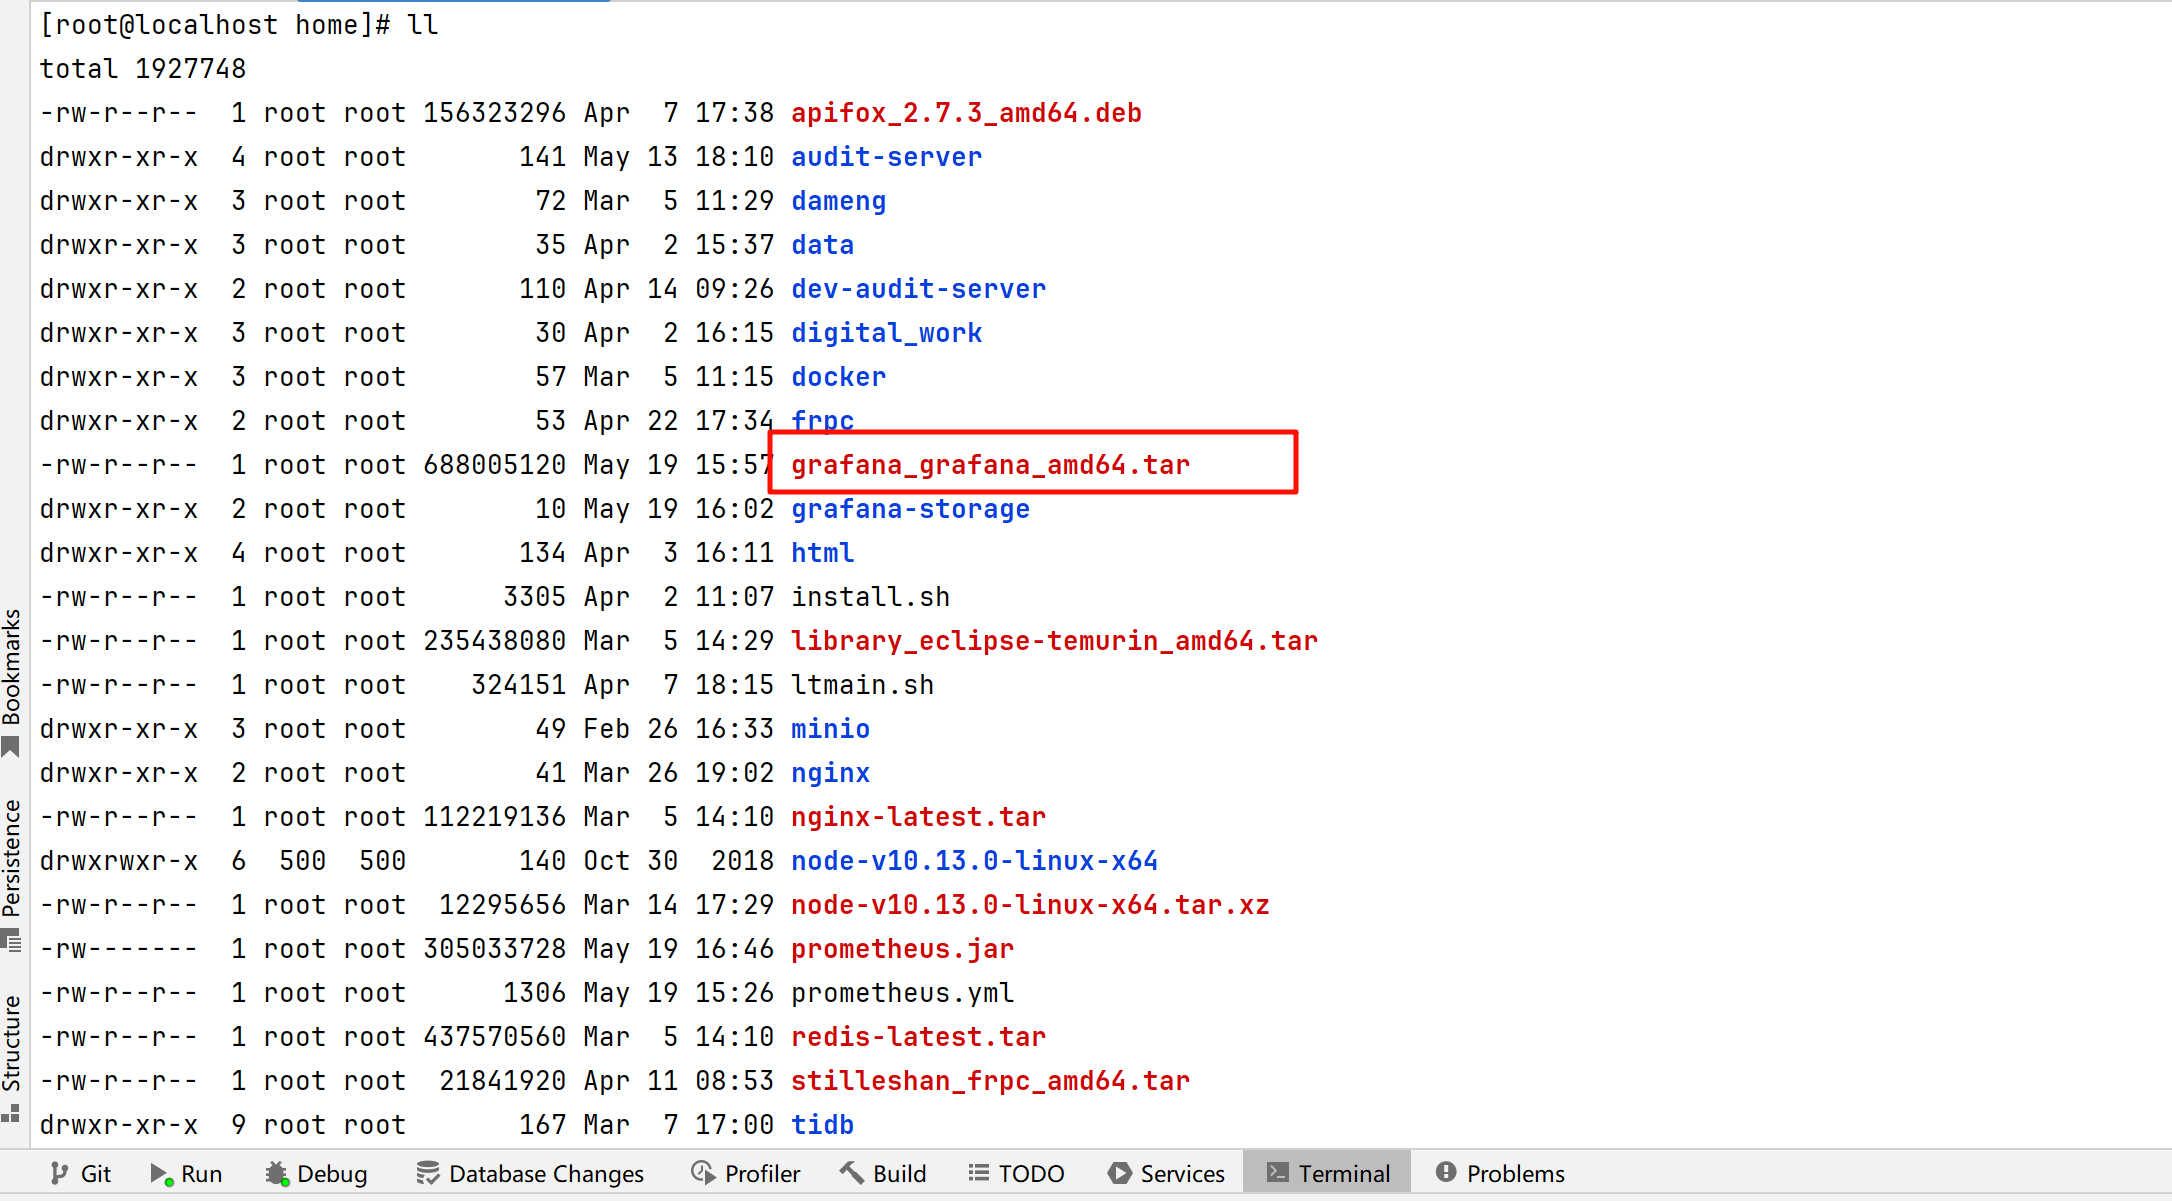
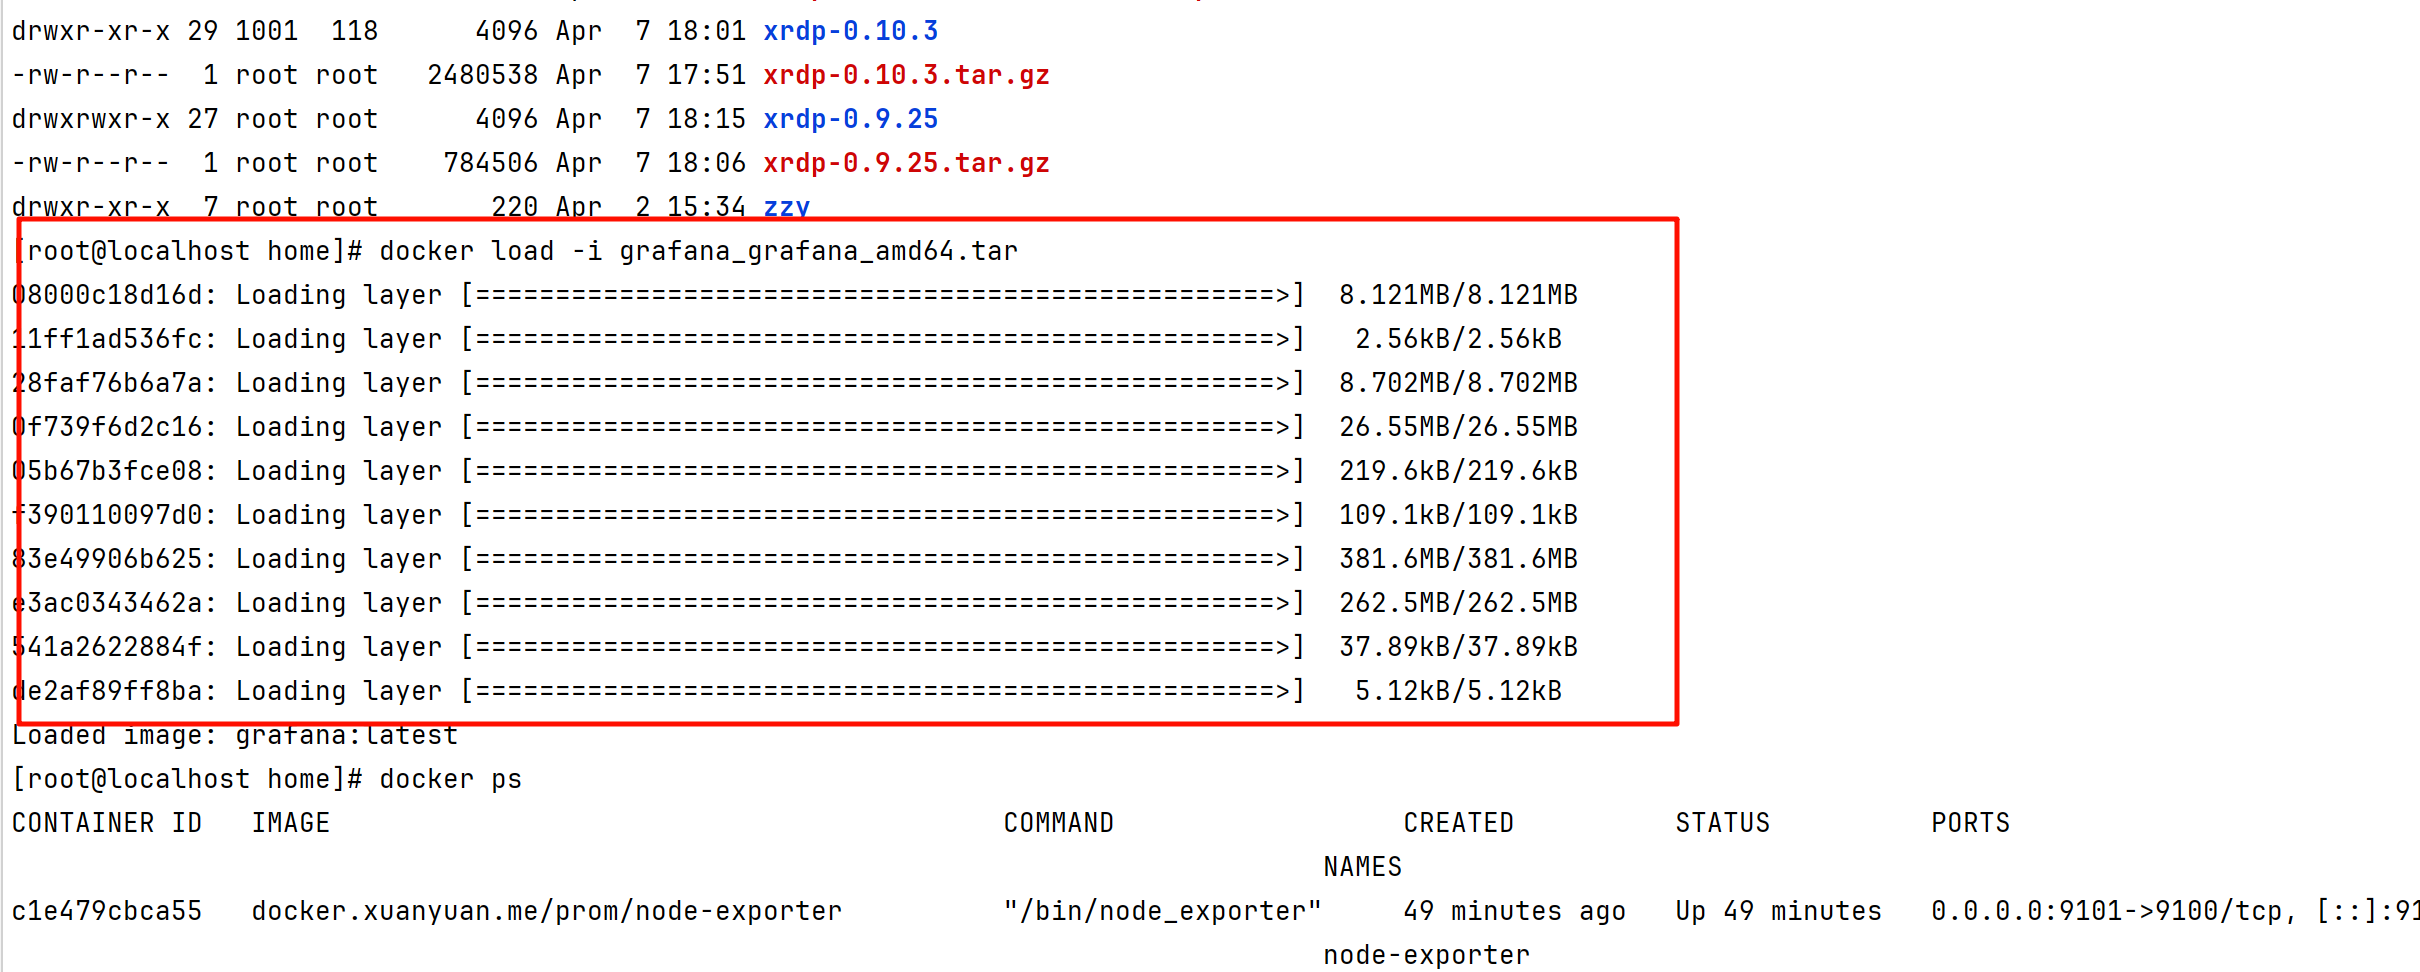
加载镜像
docker load -i grafana_grafana_amd64.tar
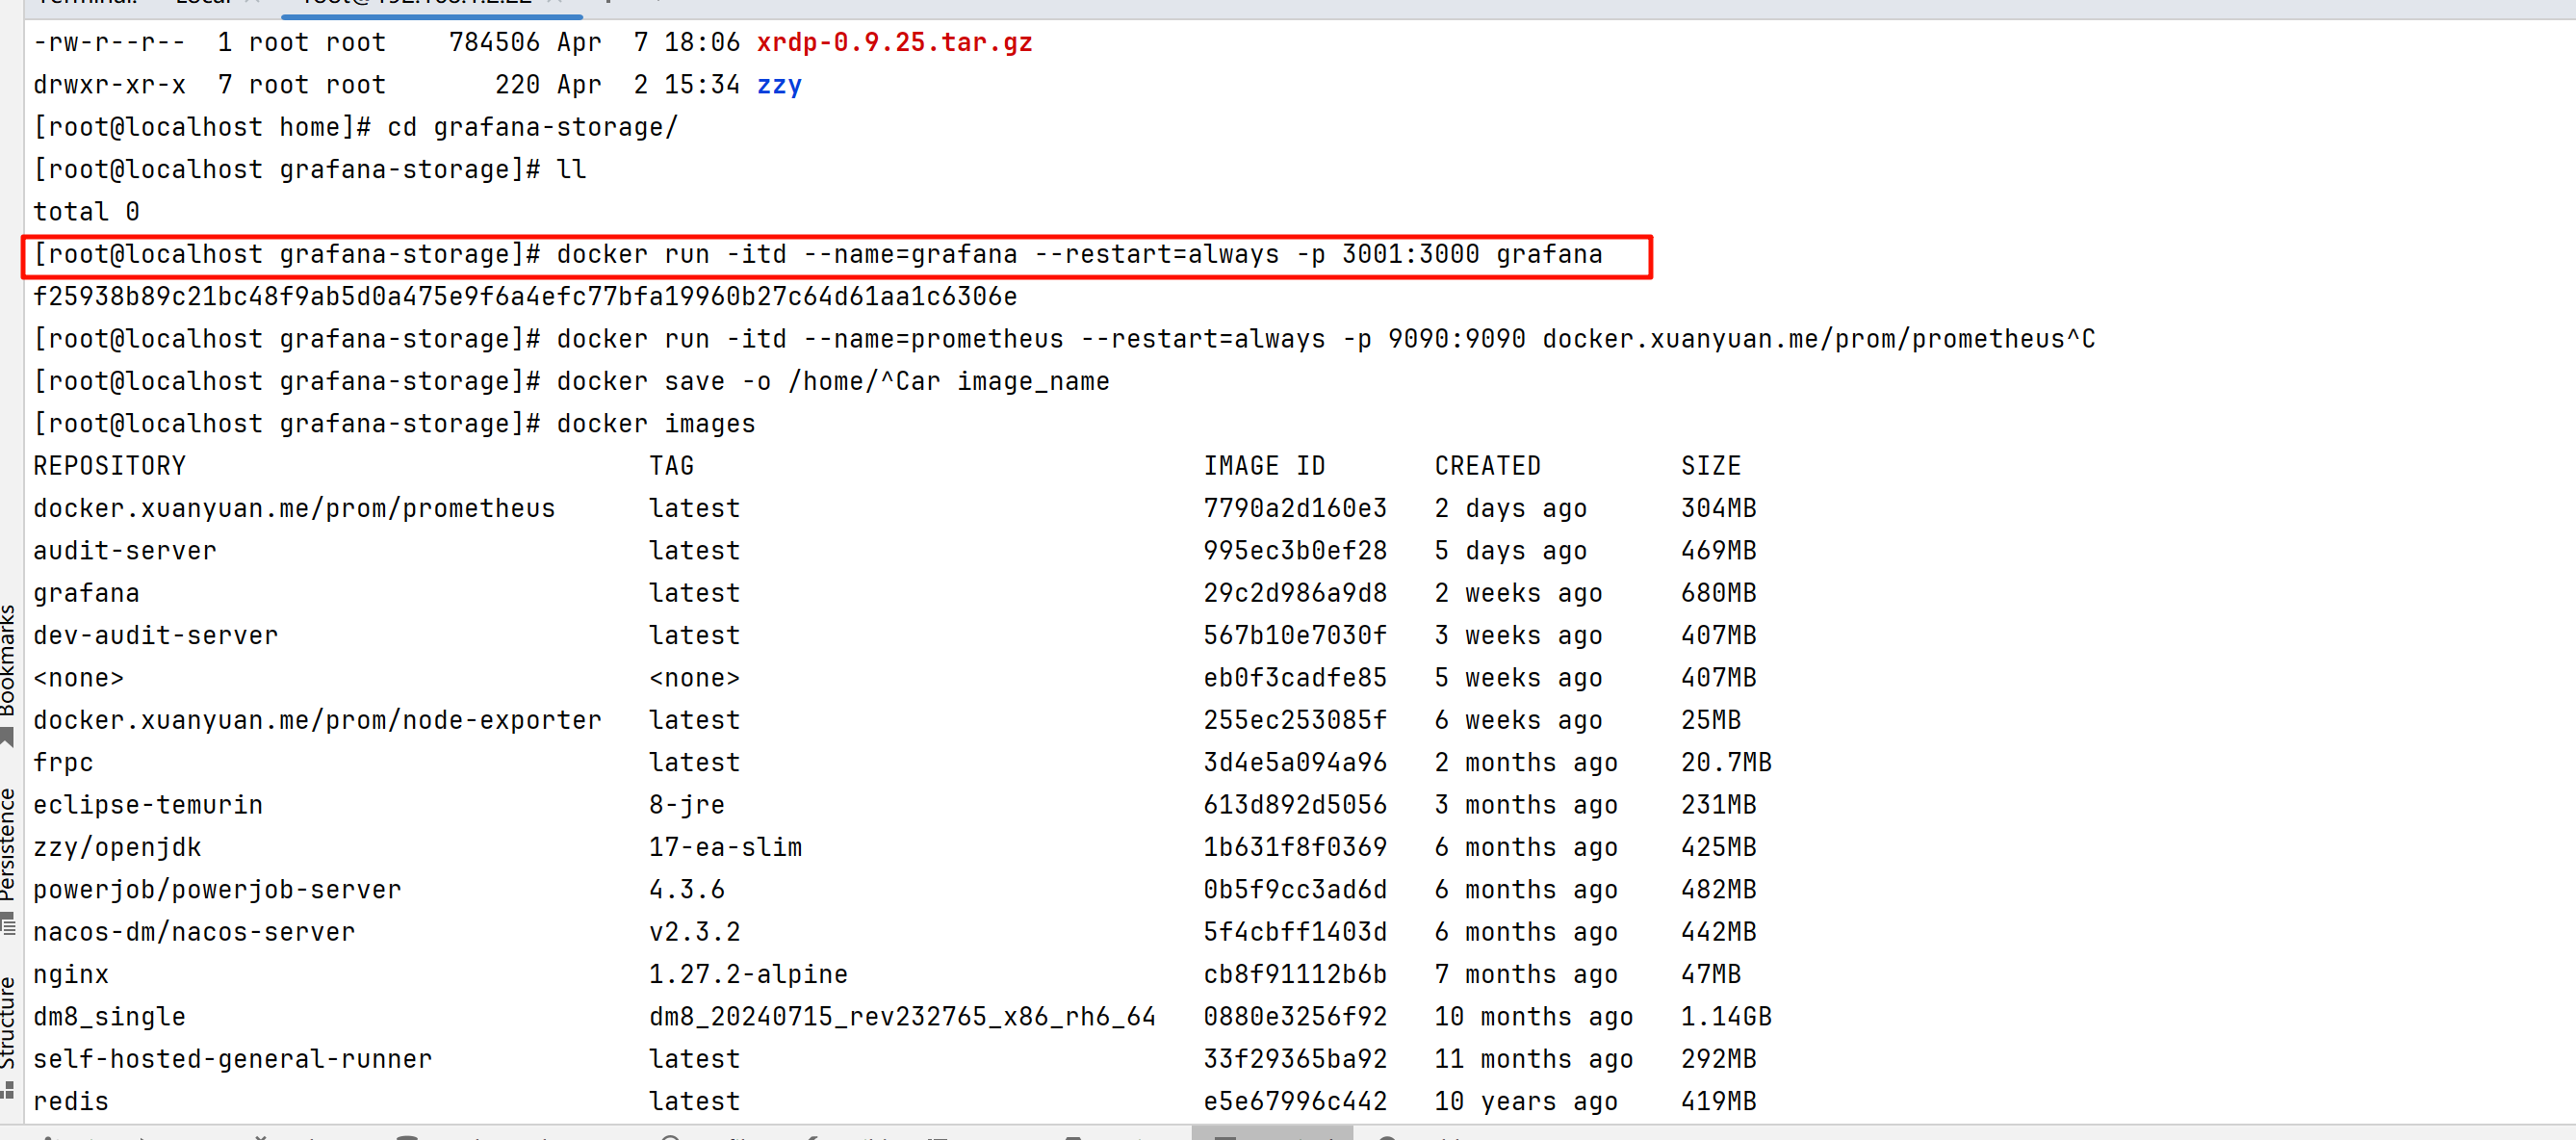
启动
docker run -itd --name=grafana --restart=always -p 3001:3000 grafana
访问
http://192.168.1.2:3001/
192.168.1.2为服务期地址
3001为服务端口,默认为3000
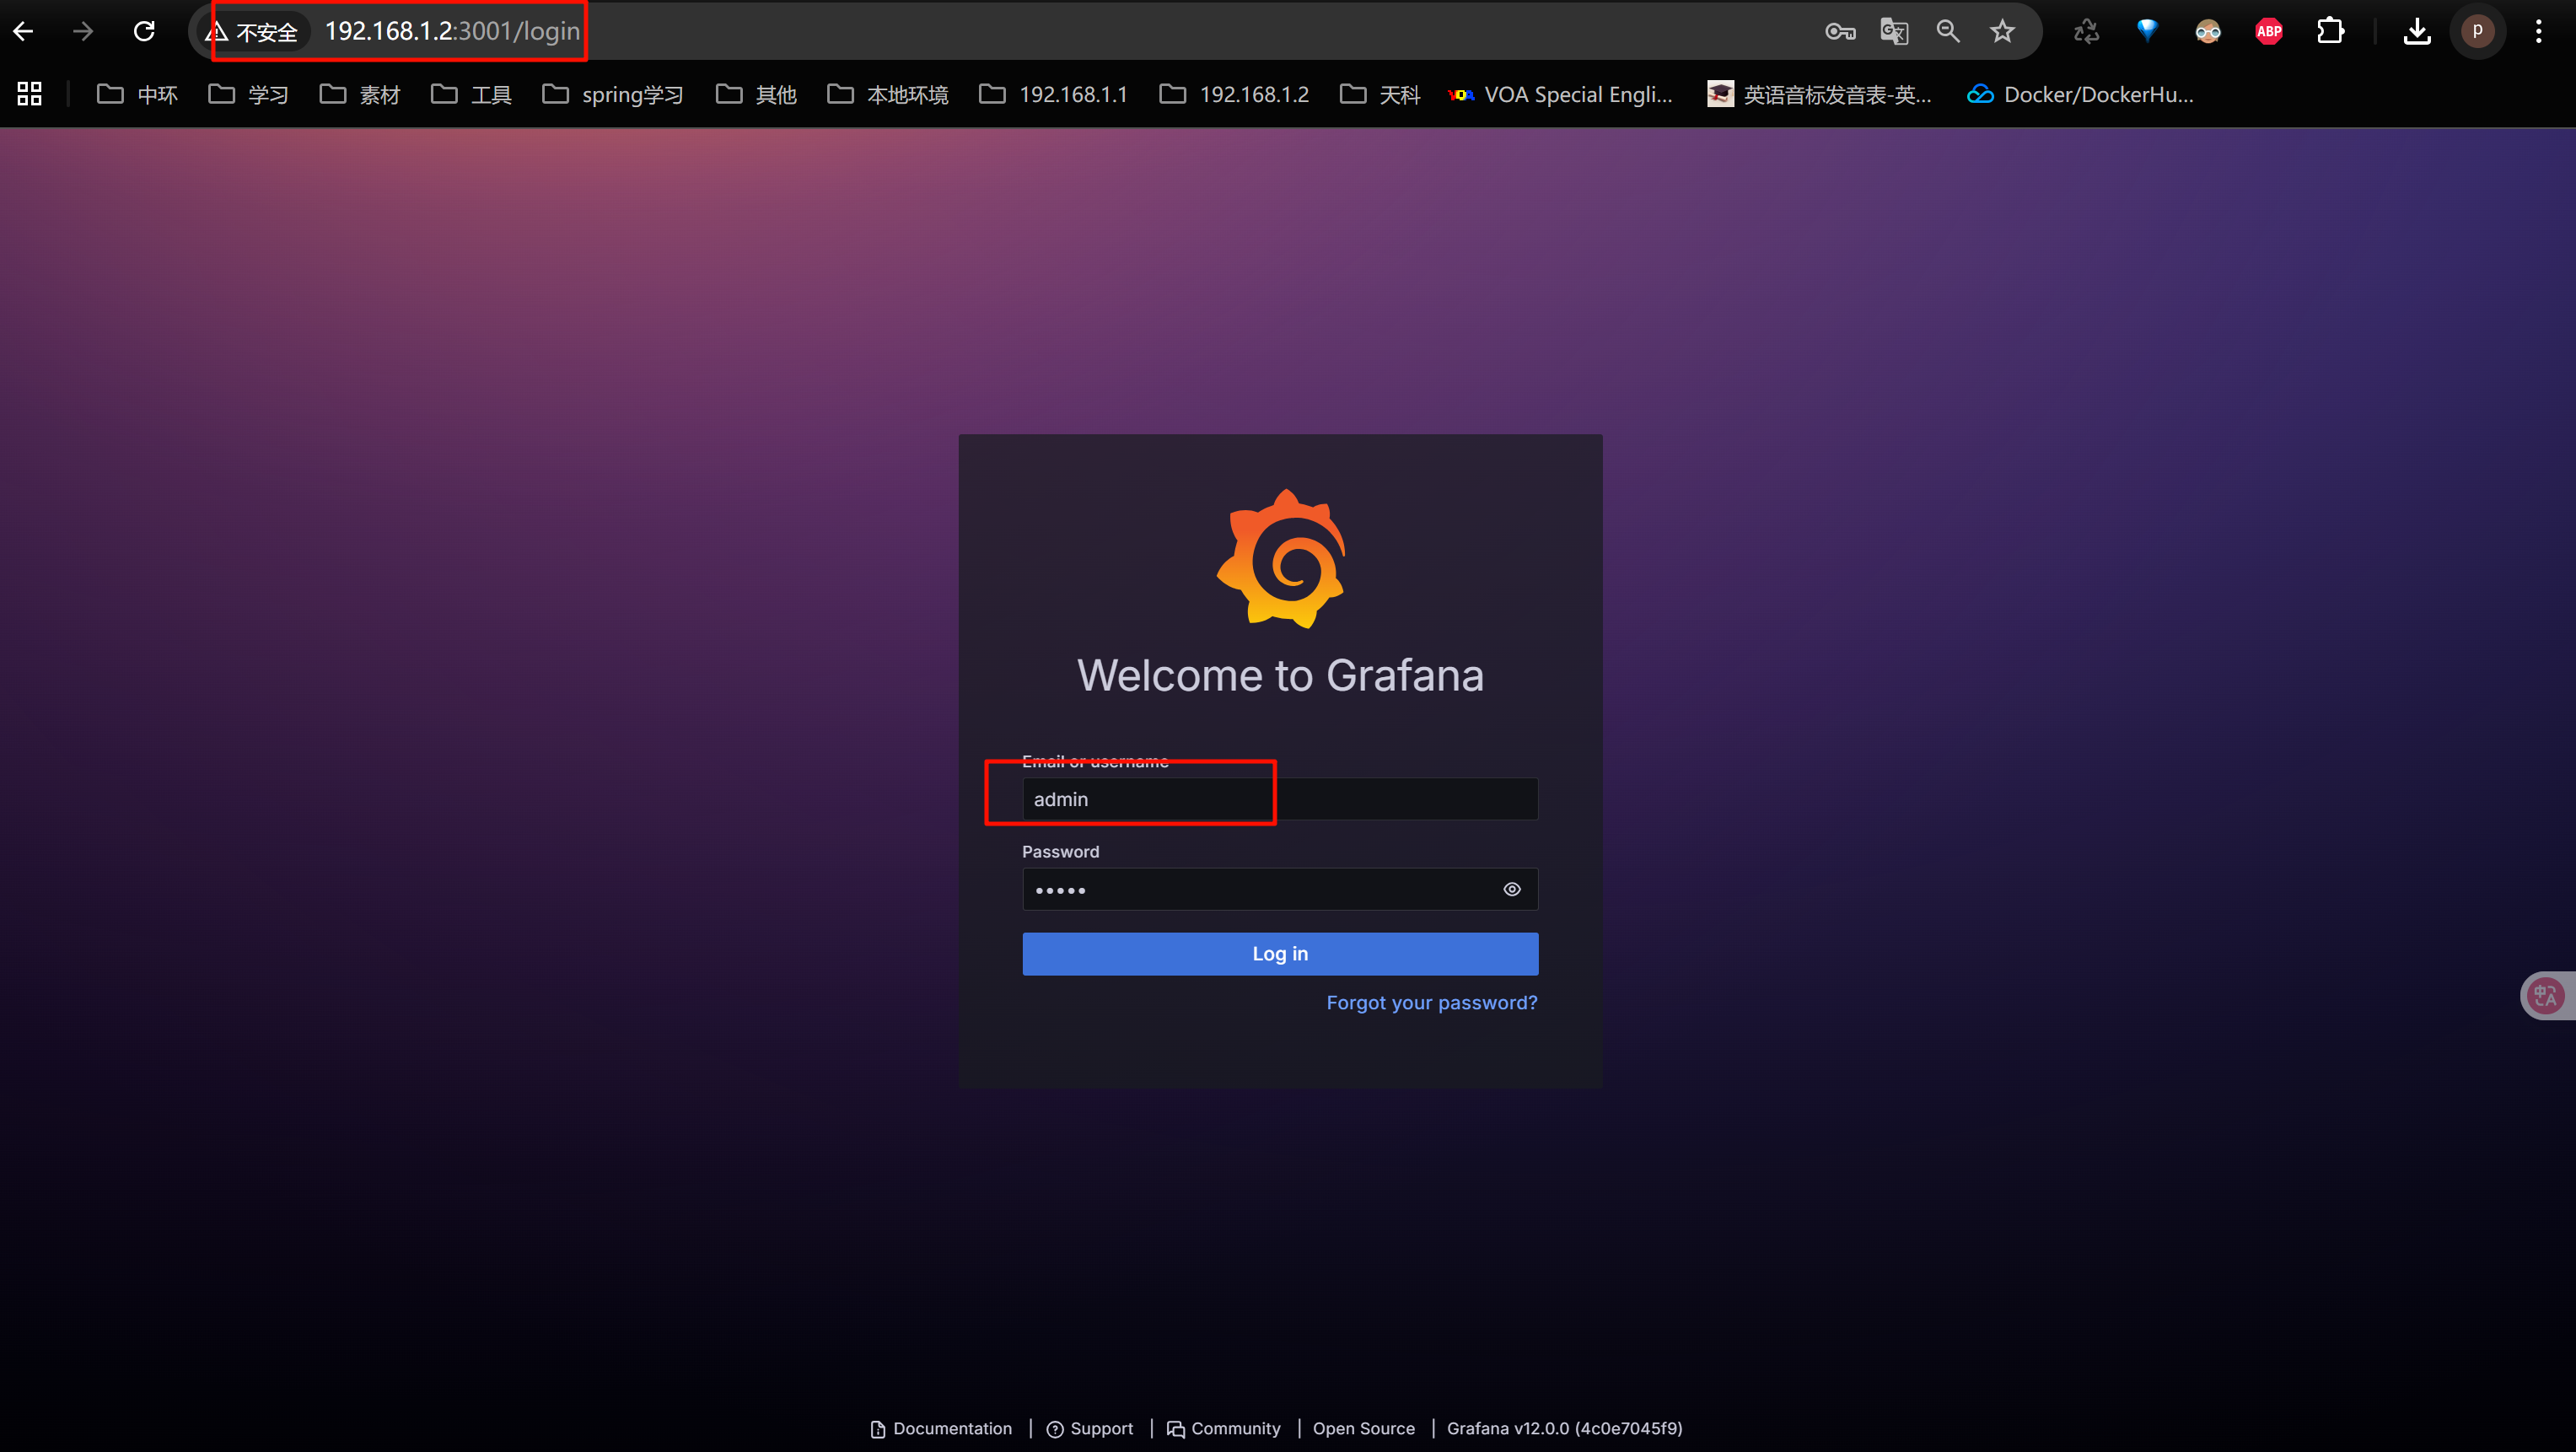
首次登录默认账号密码都为admin
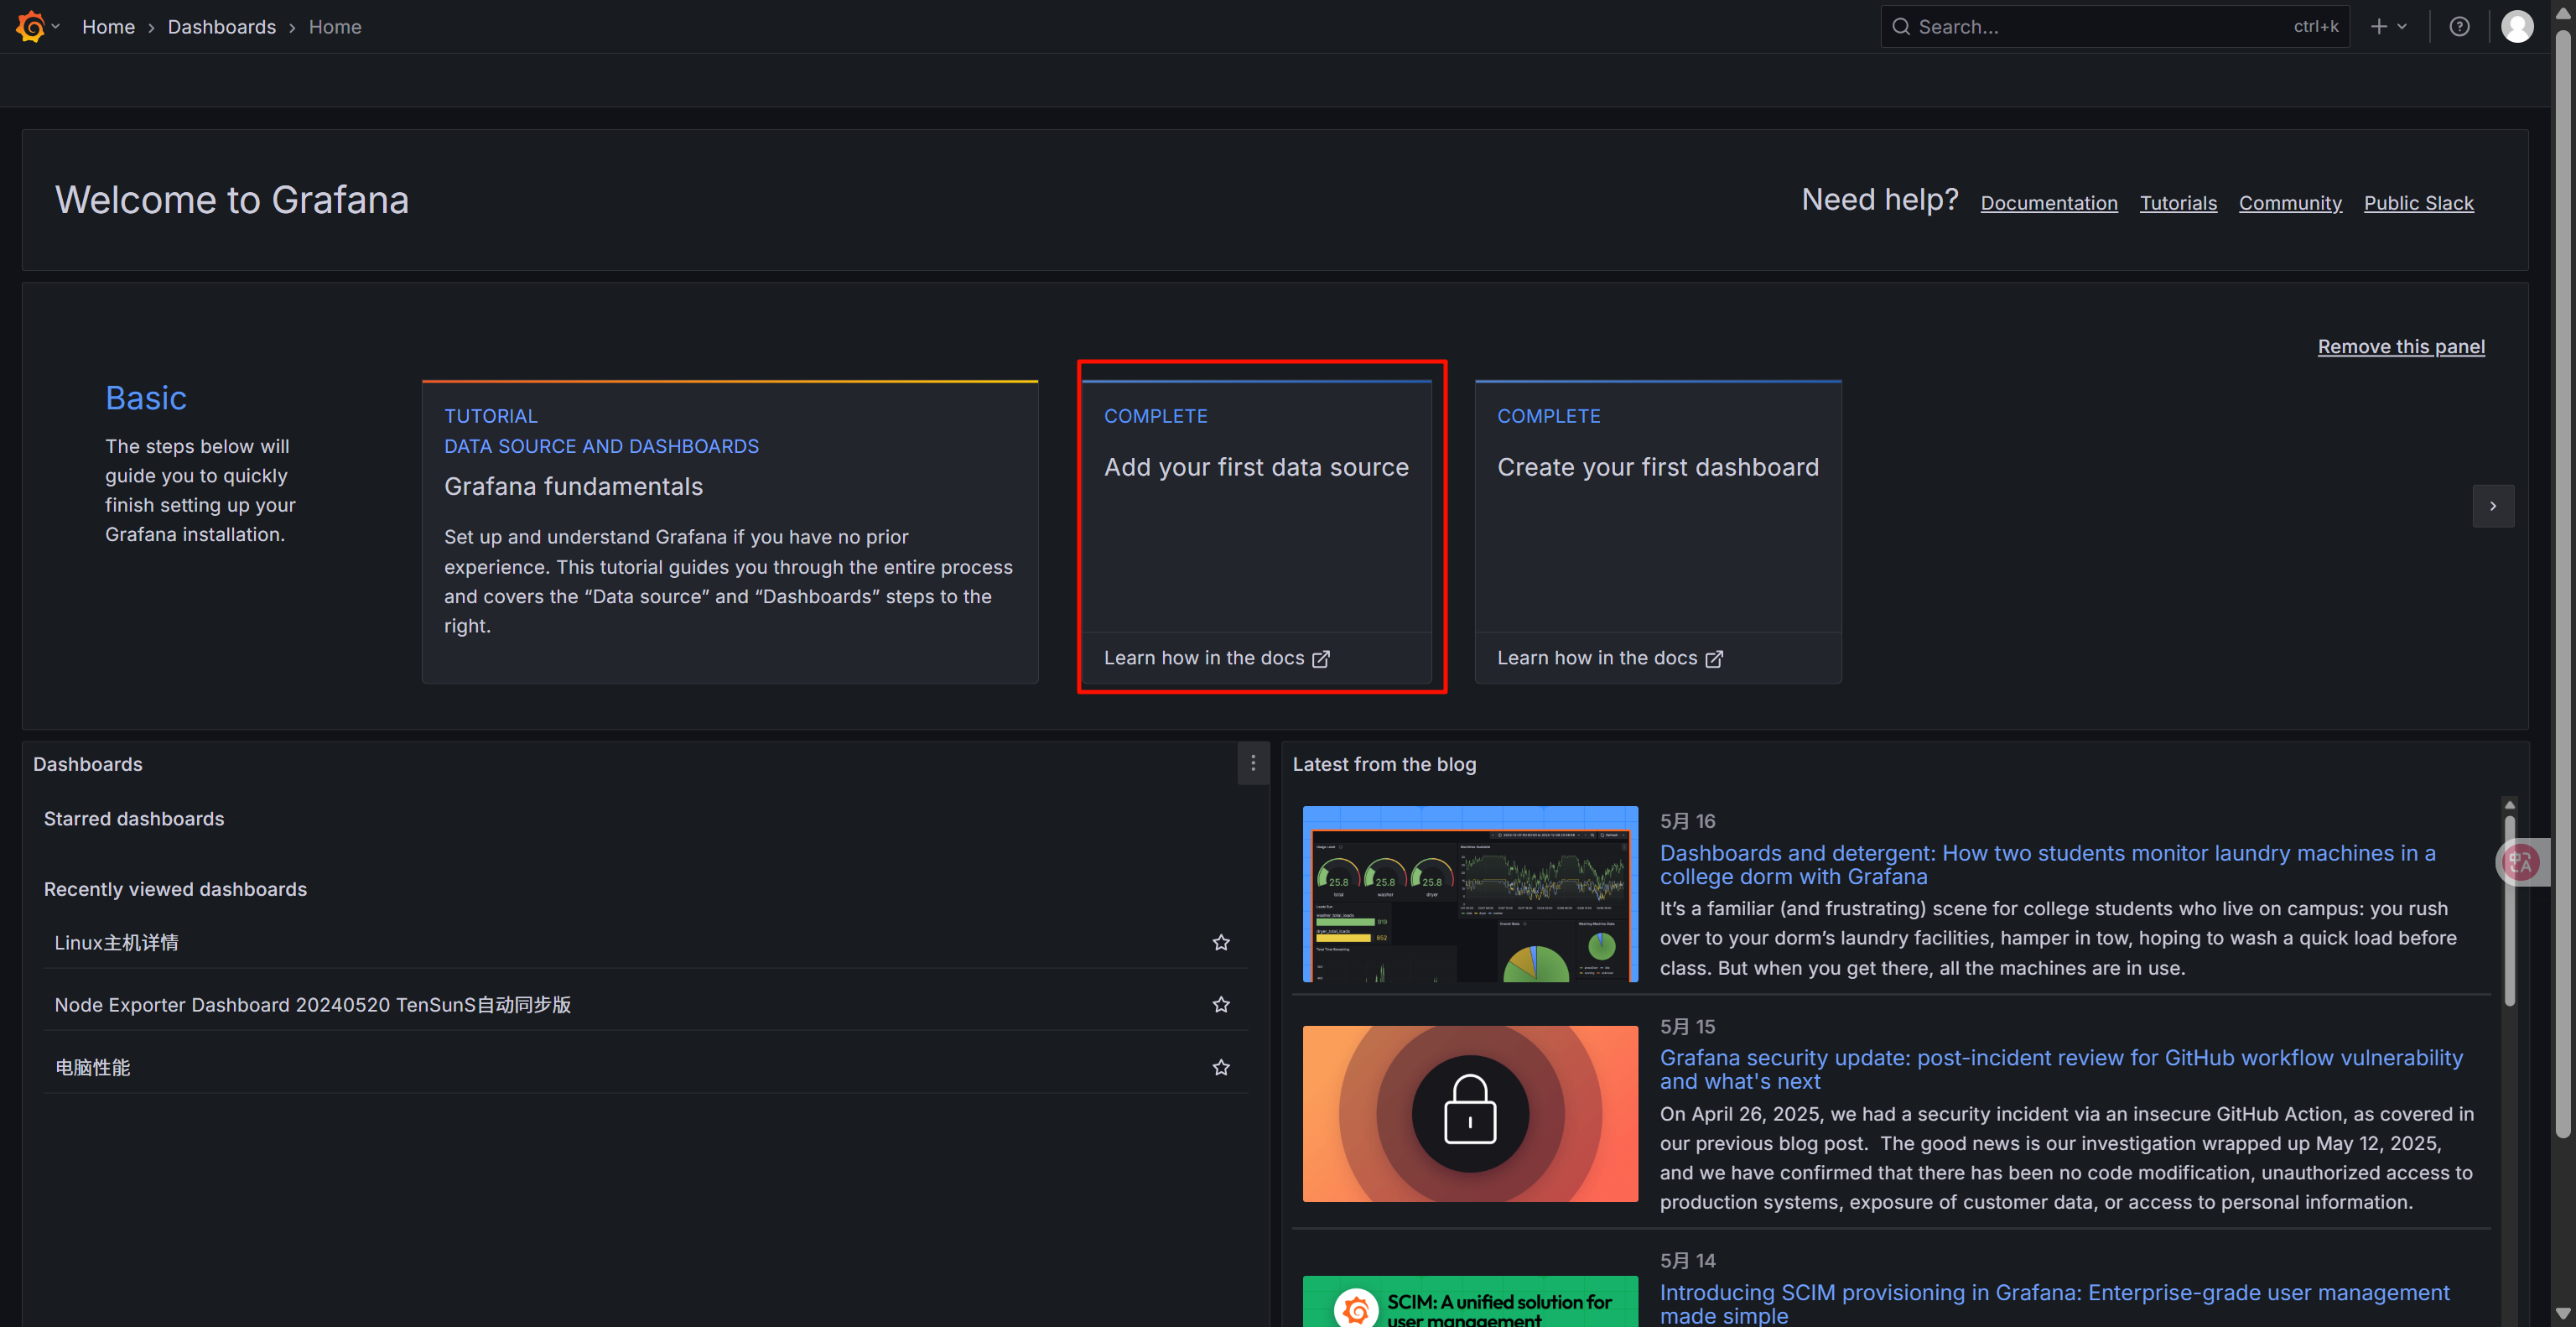
配置
1、添加数据源
2、配置Prometheus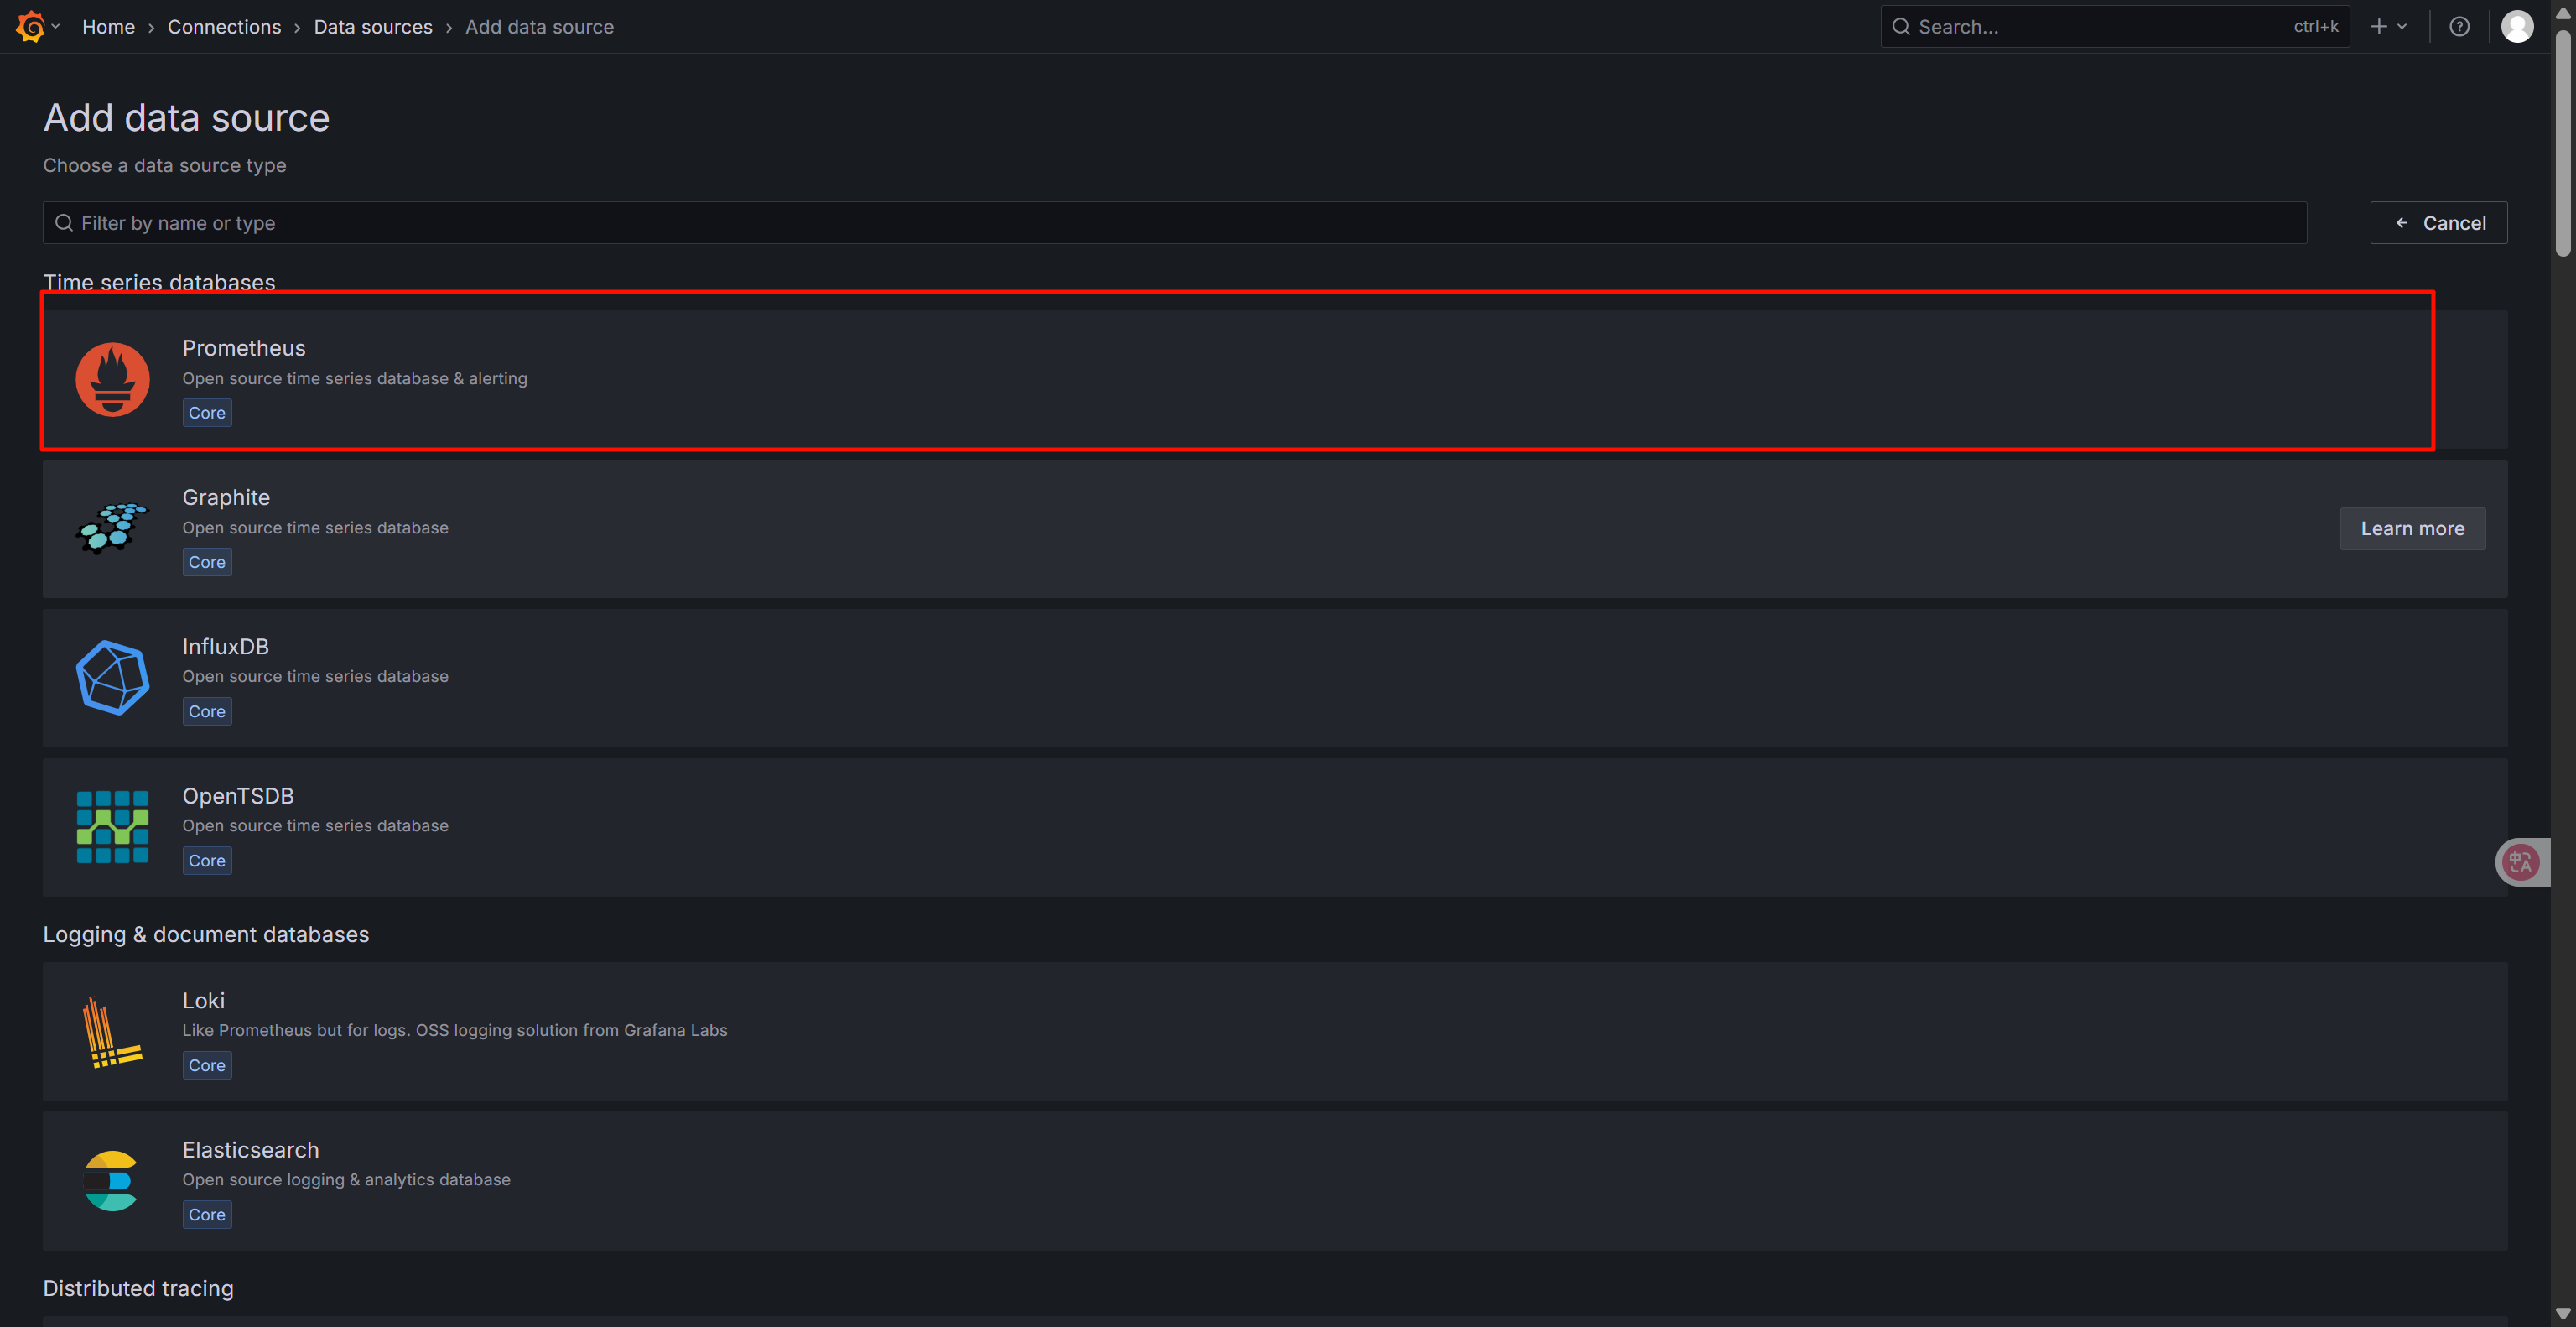
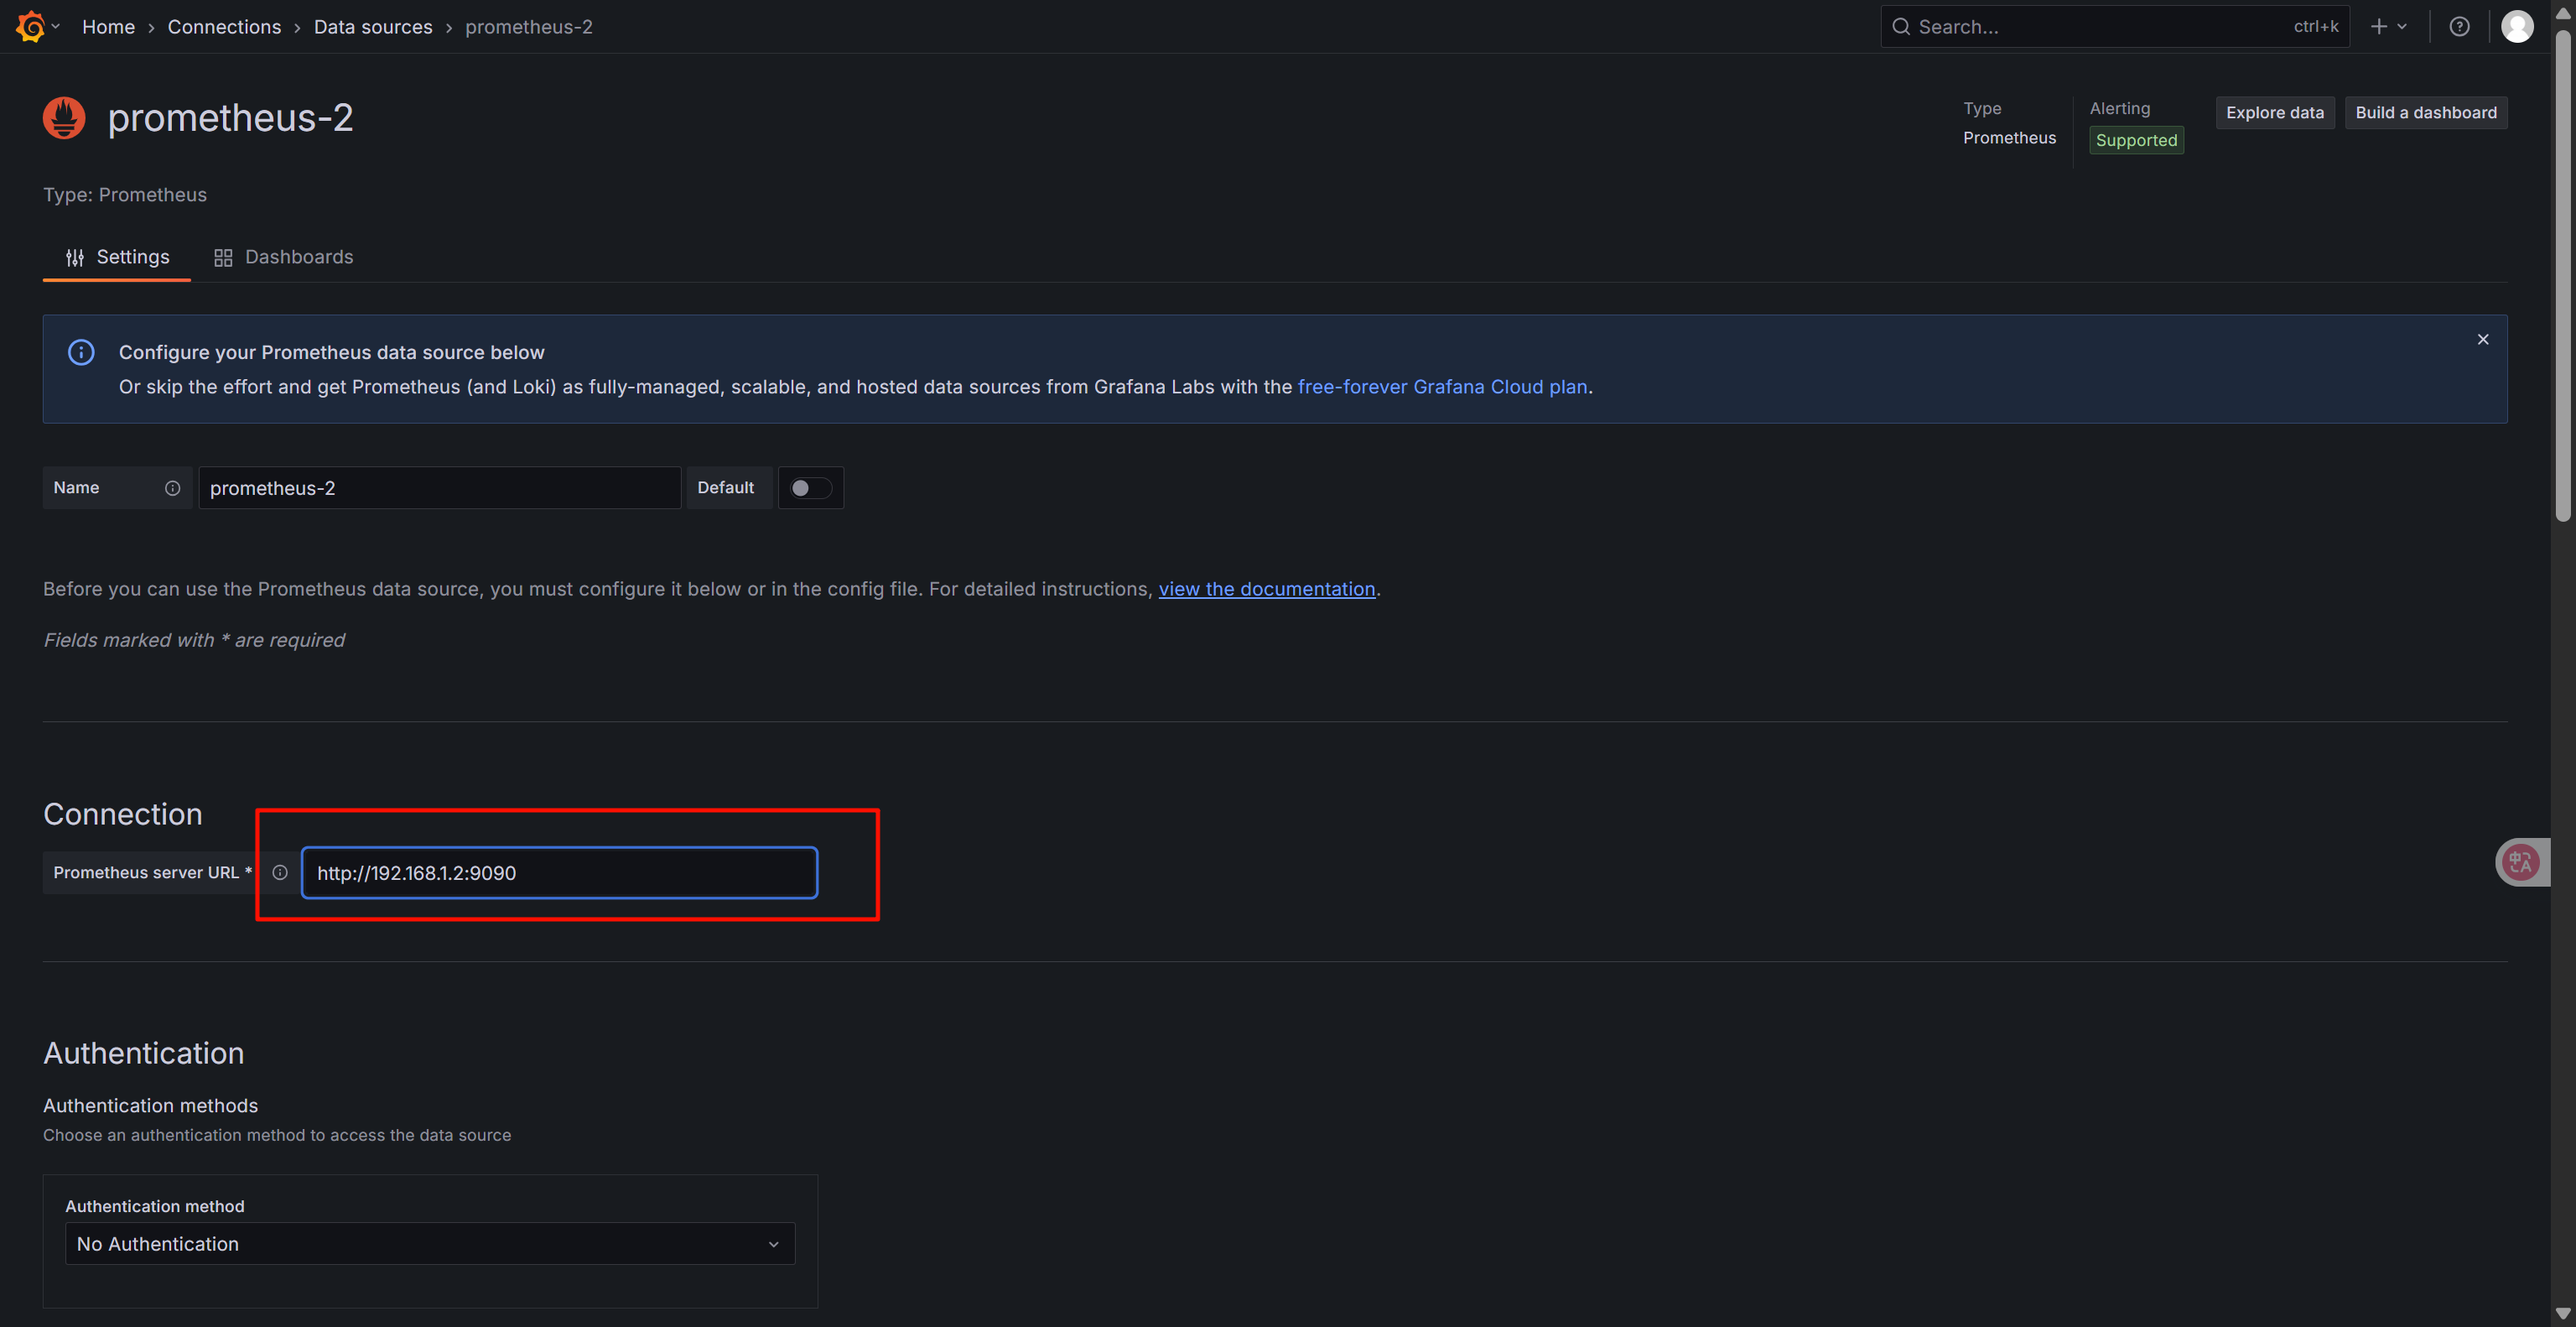
3、配置地址
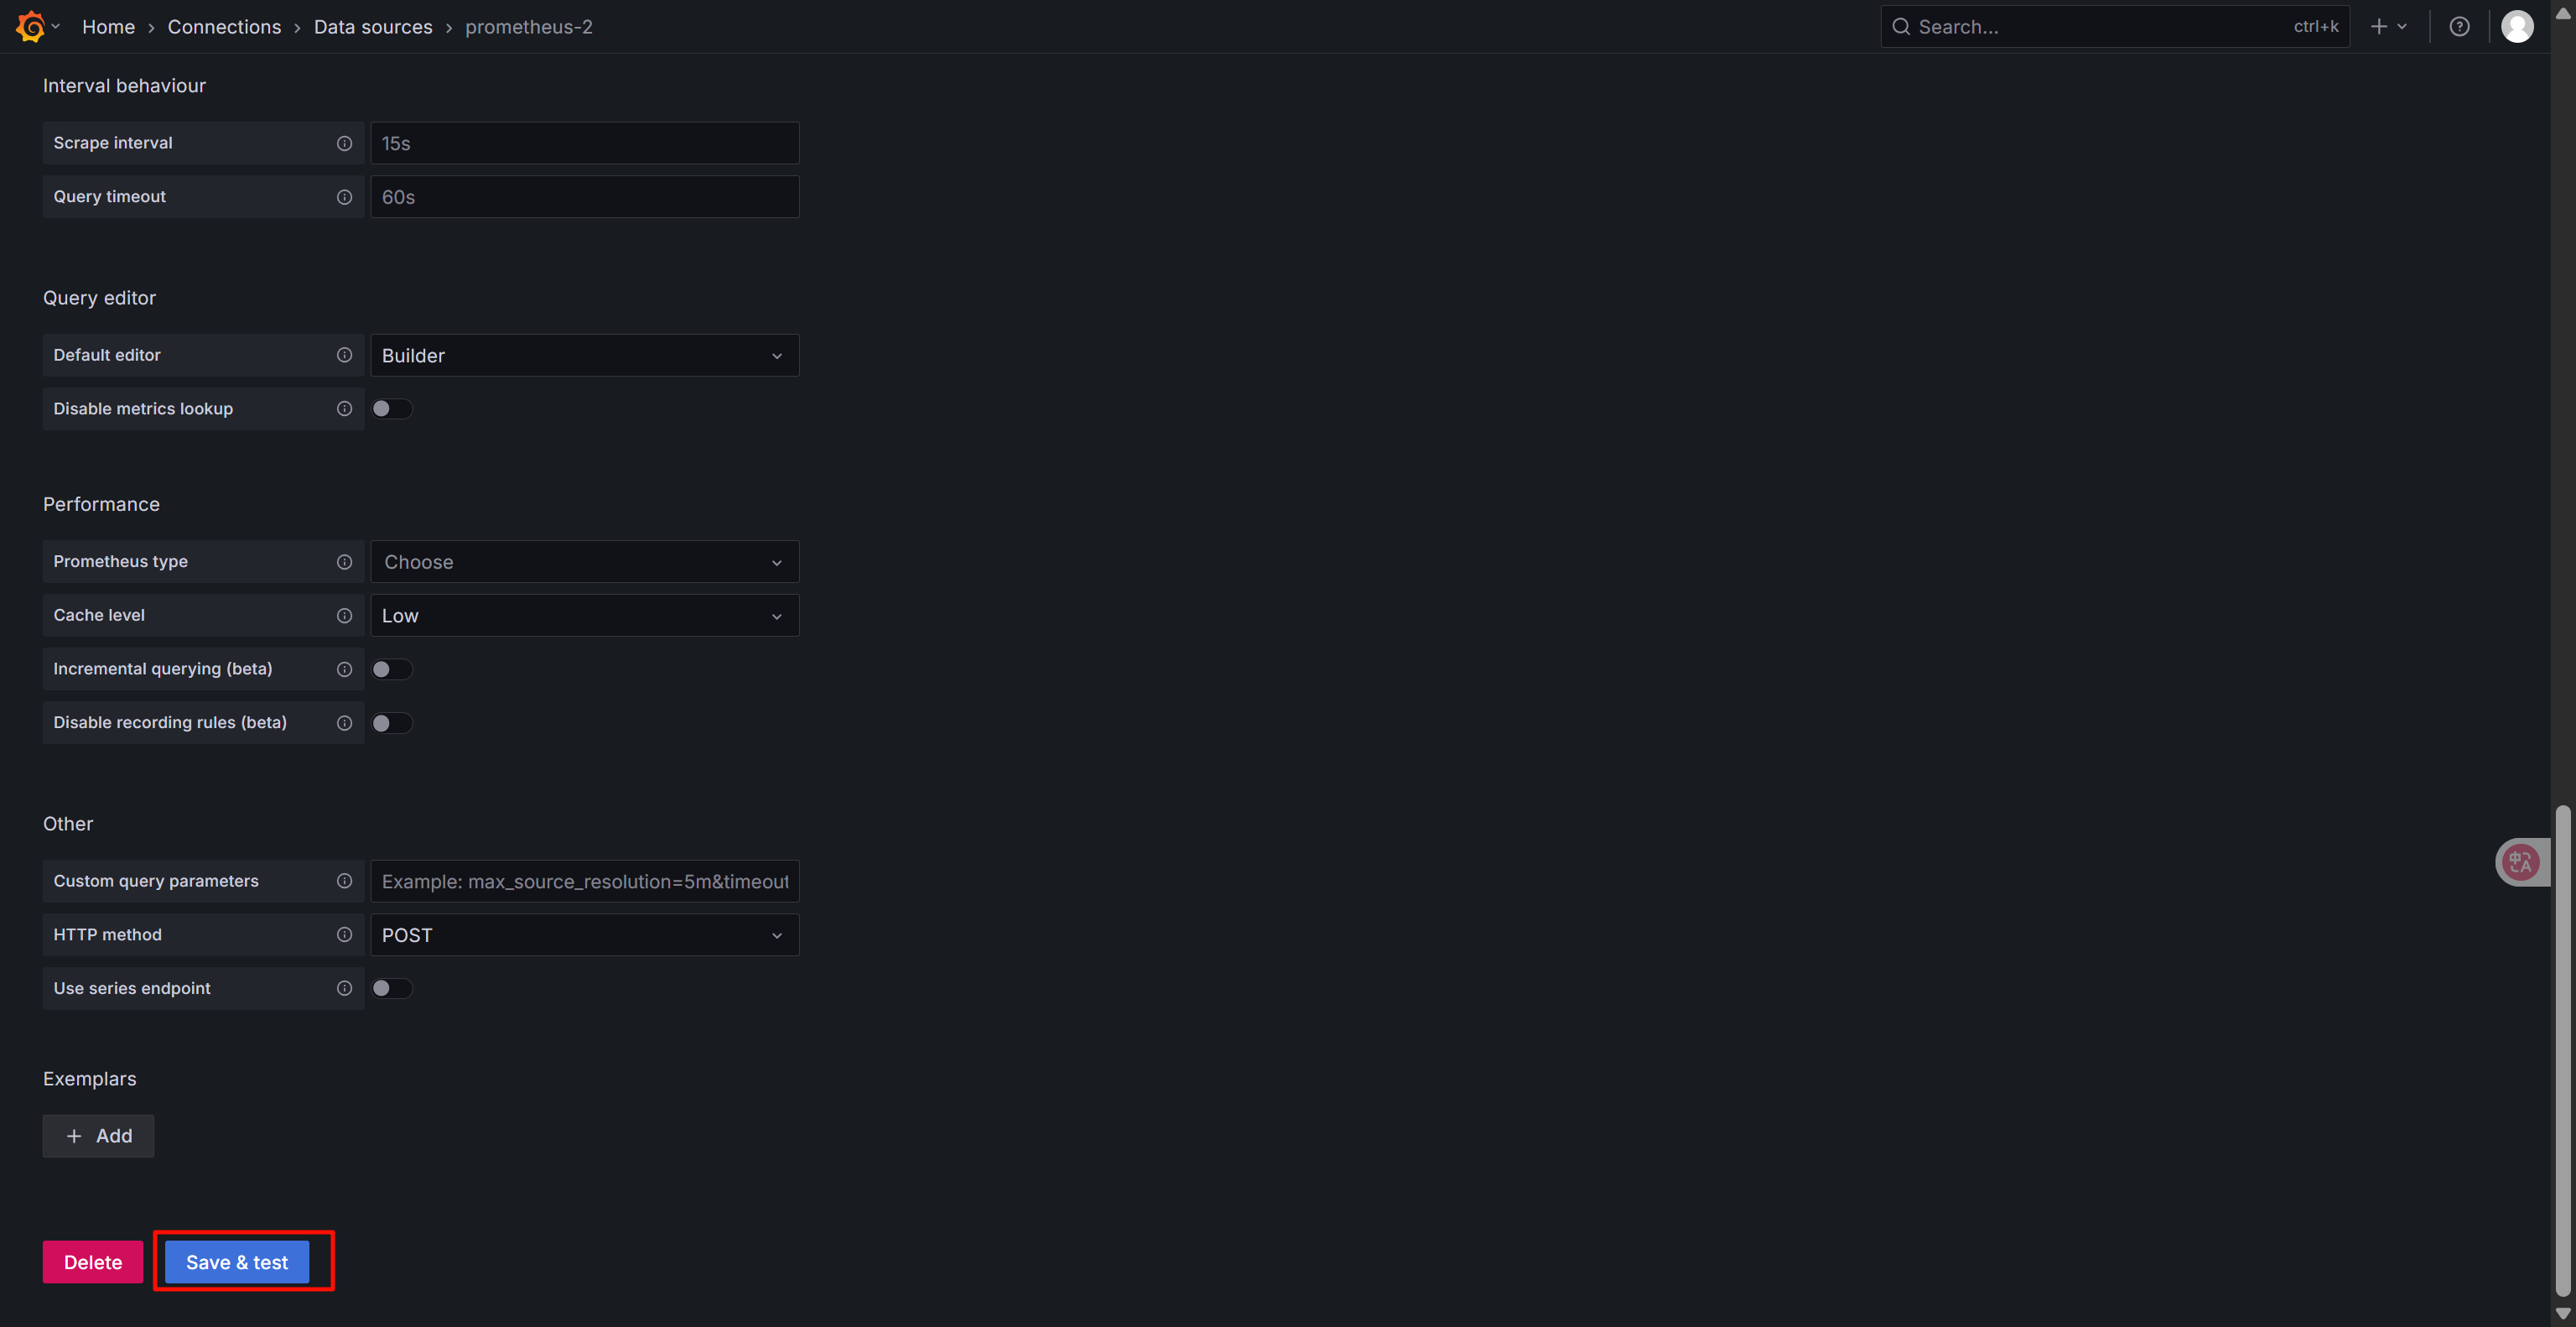
4、保存
5、添加面板
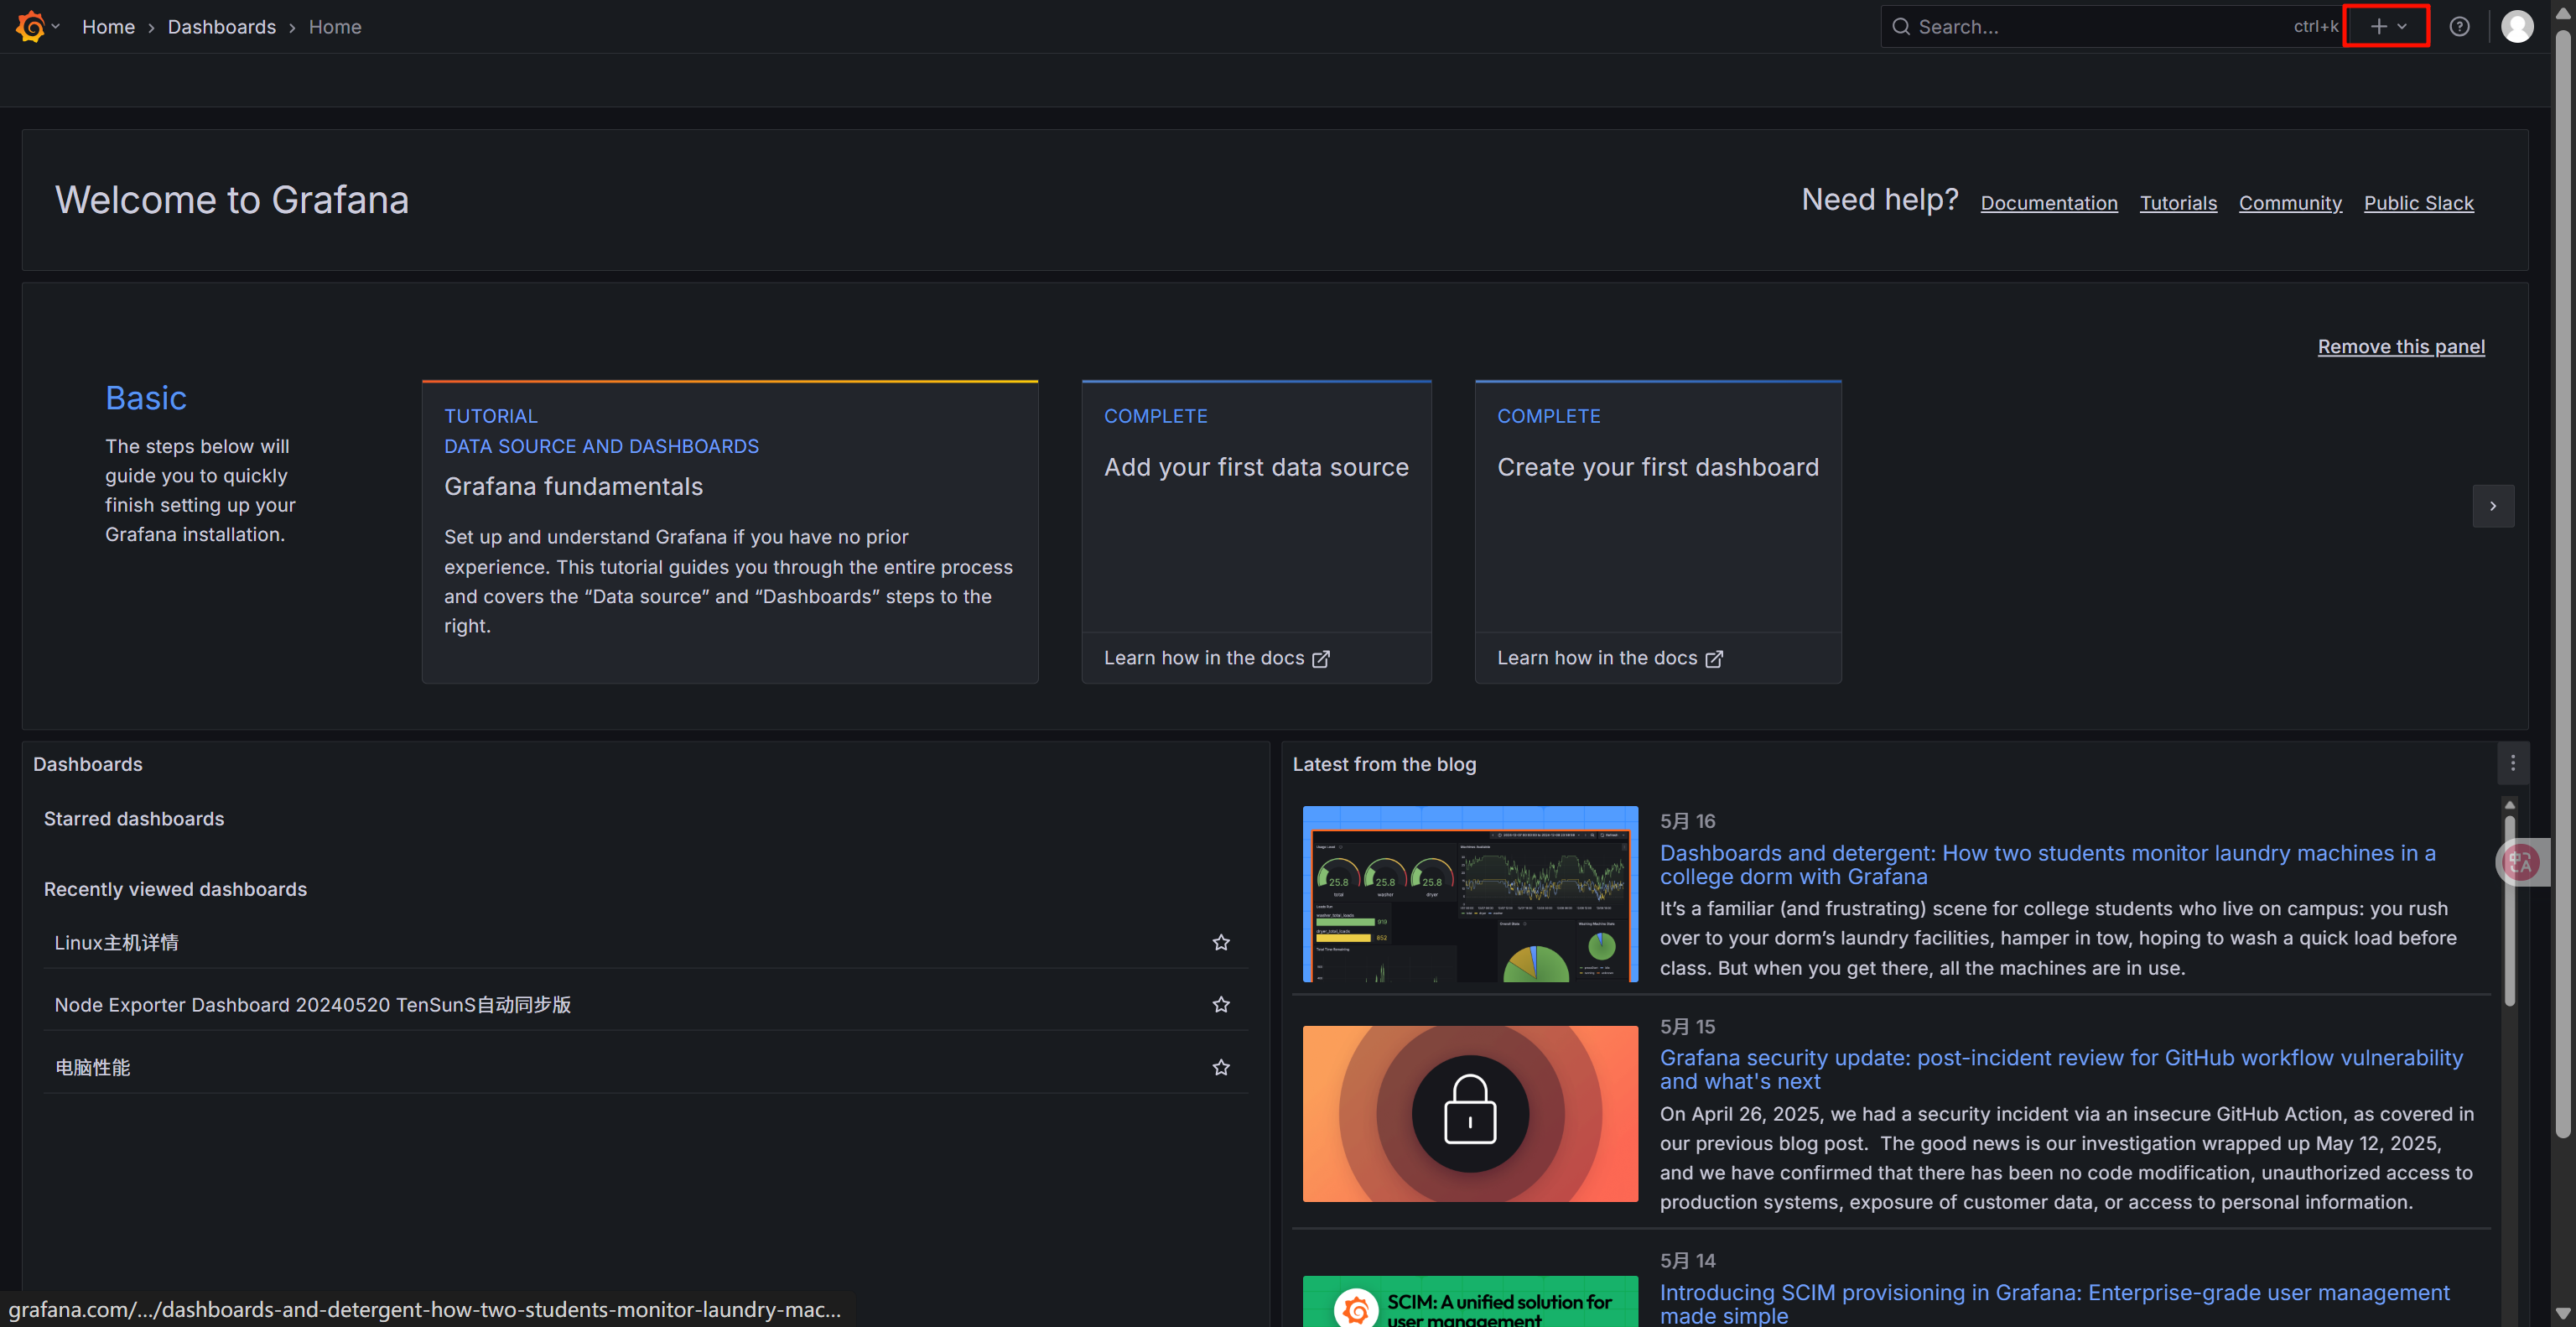
6、添加导入面板
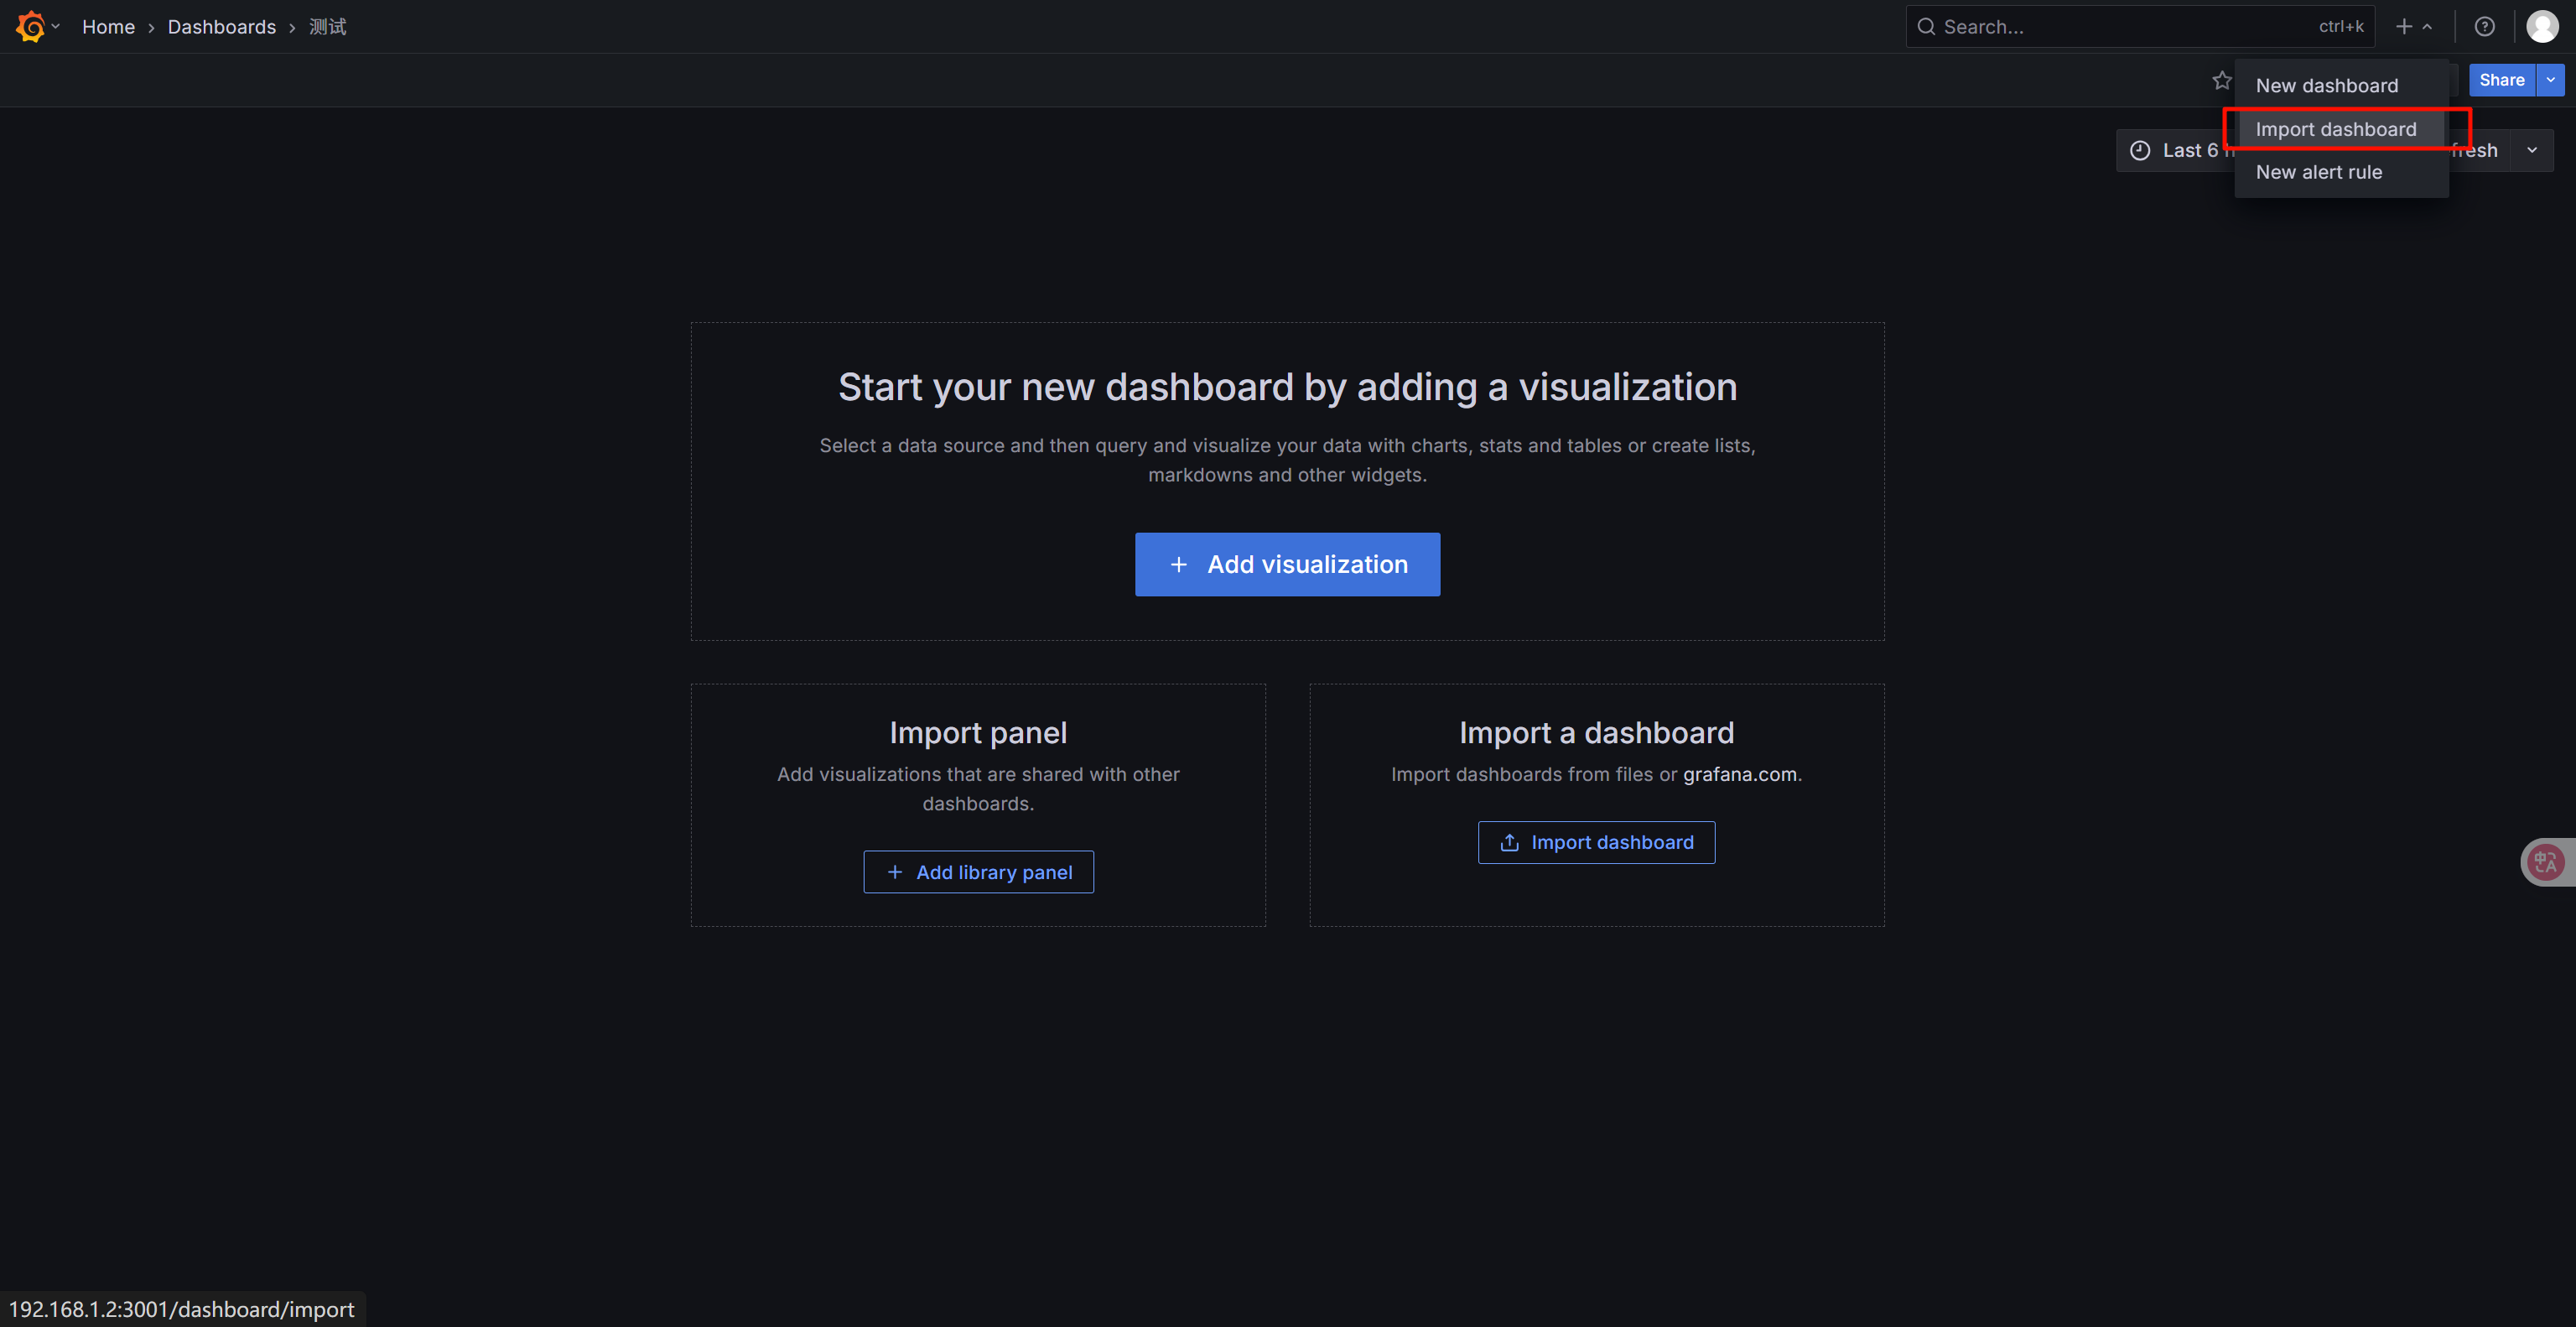
7、输入8919下载模板
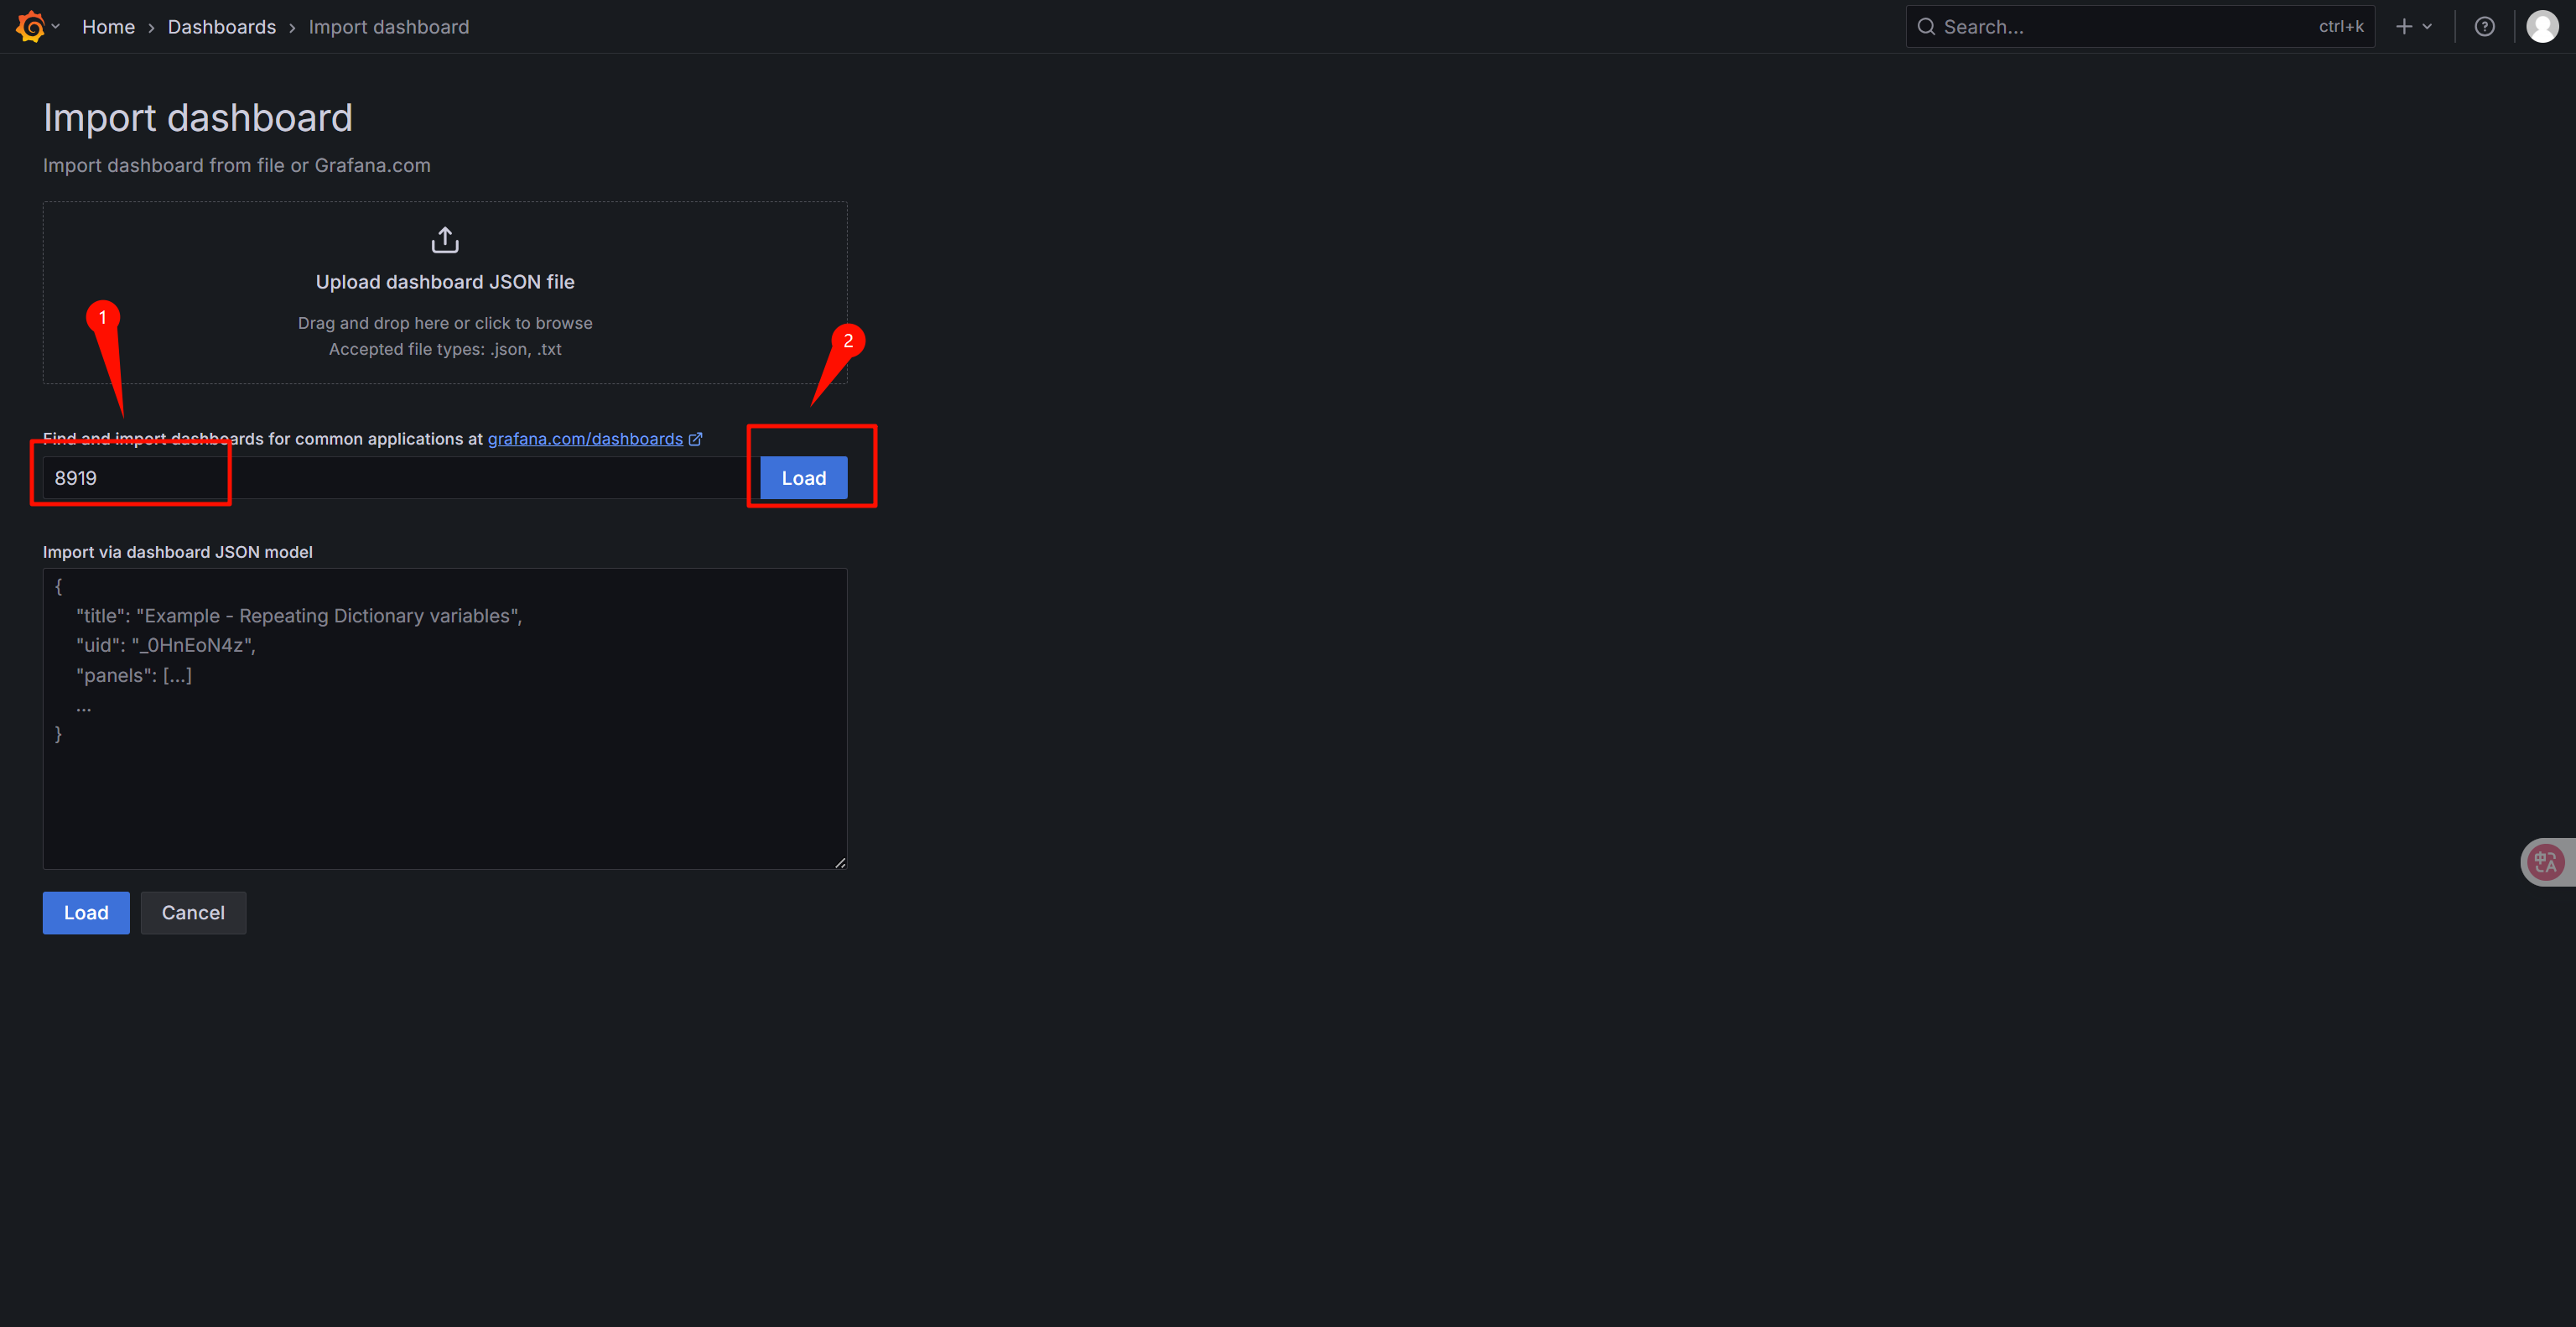
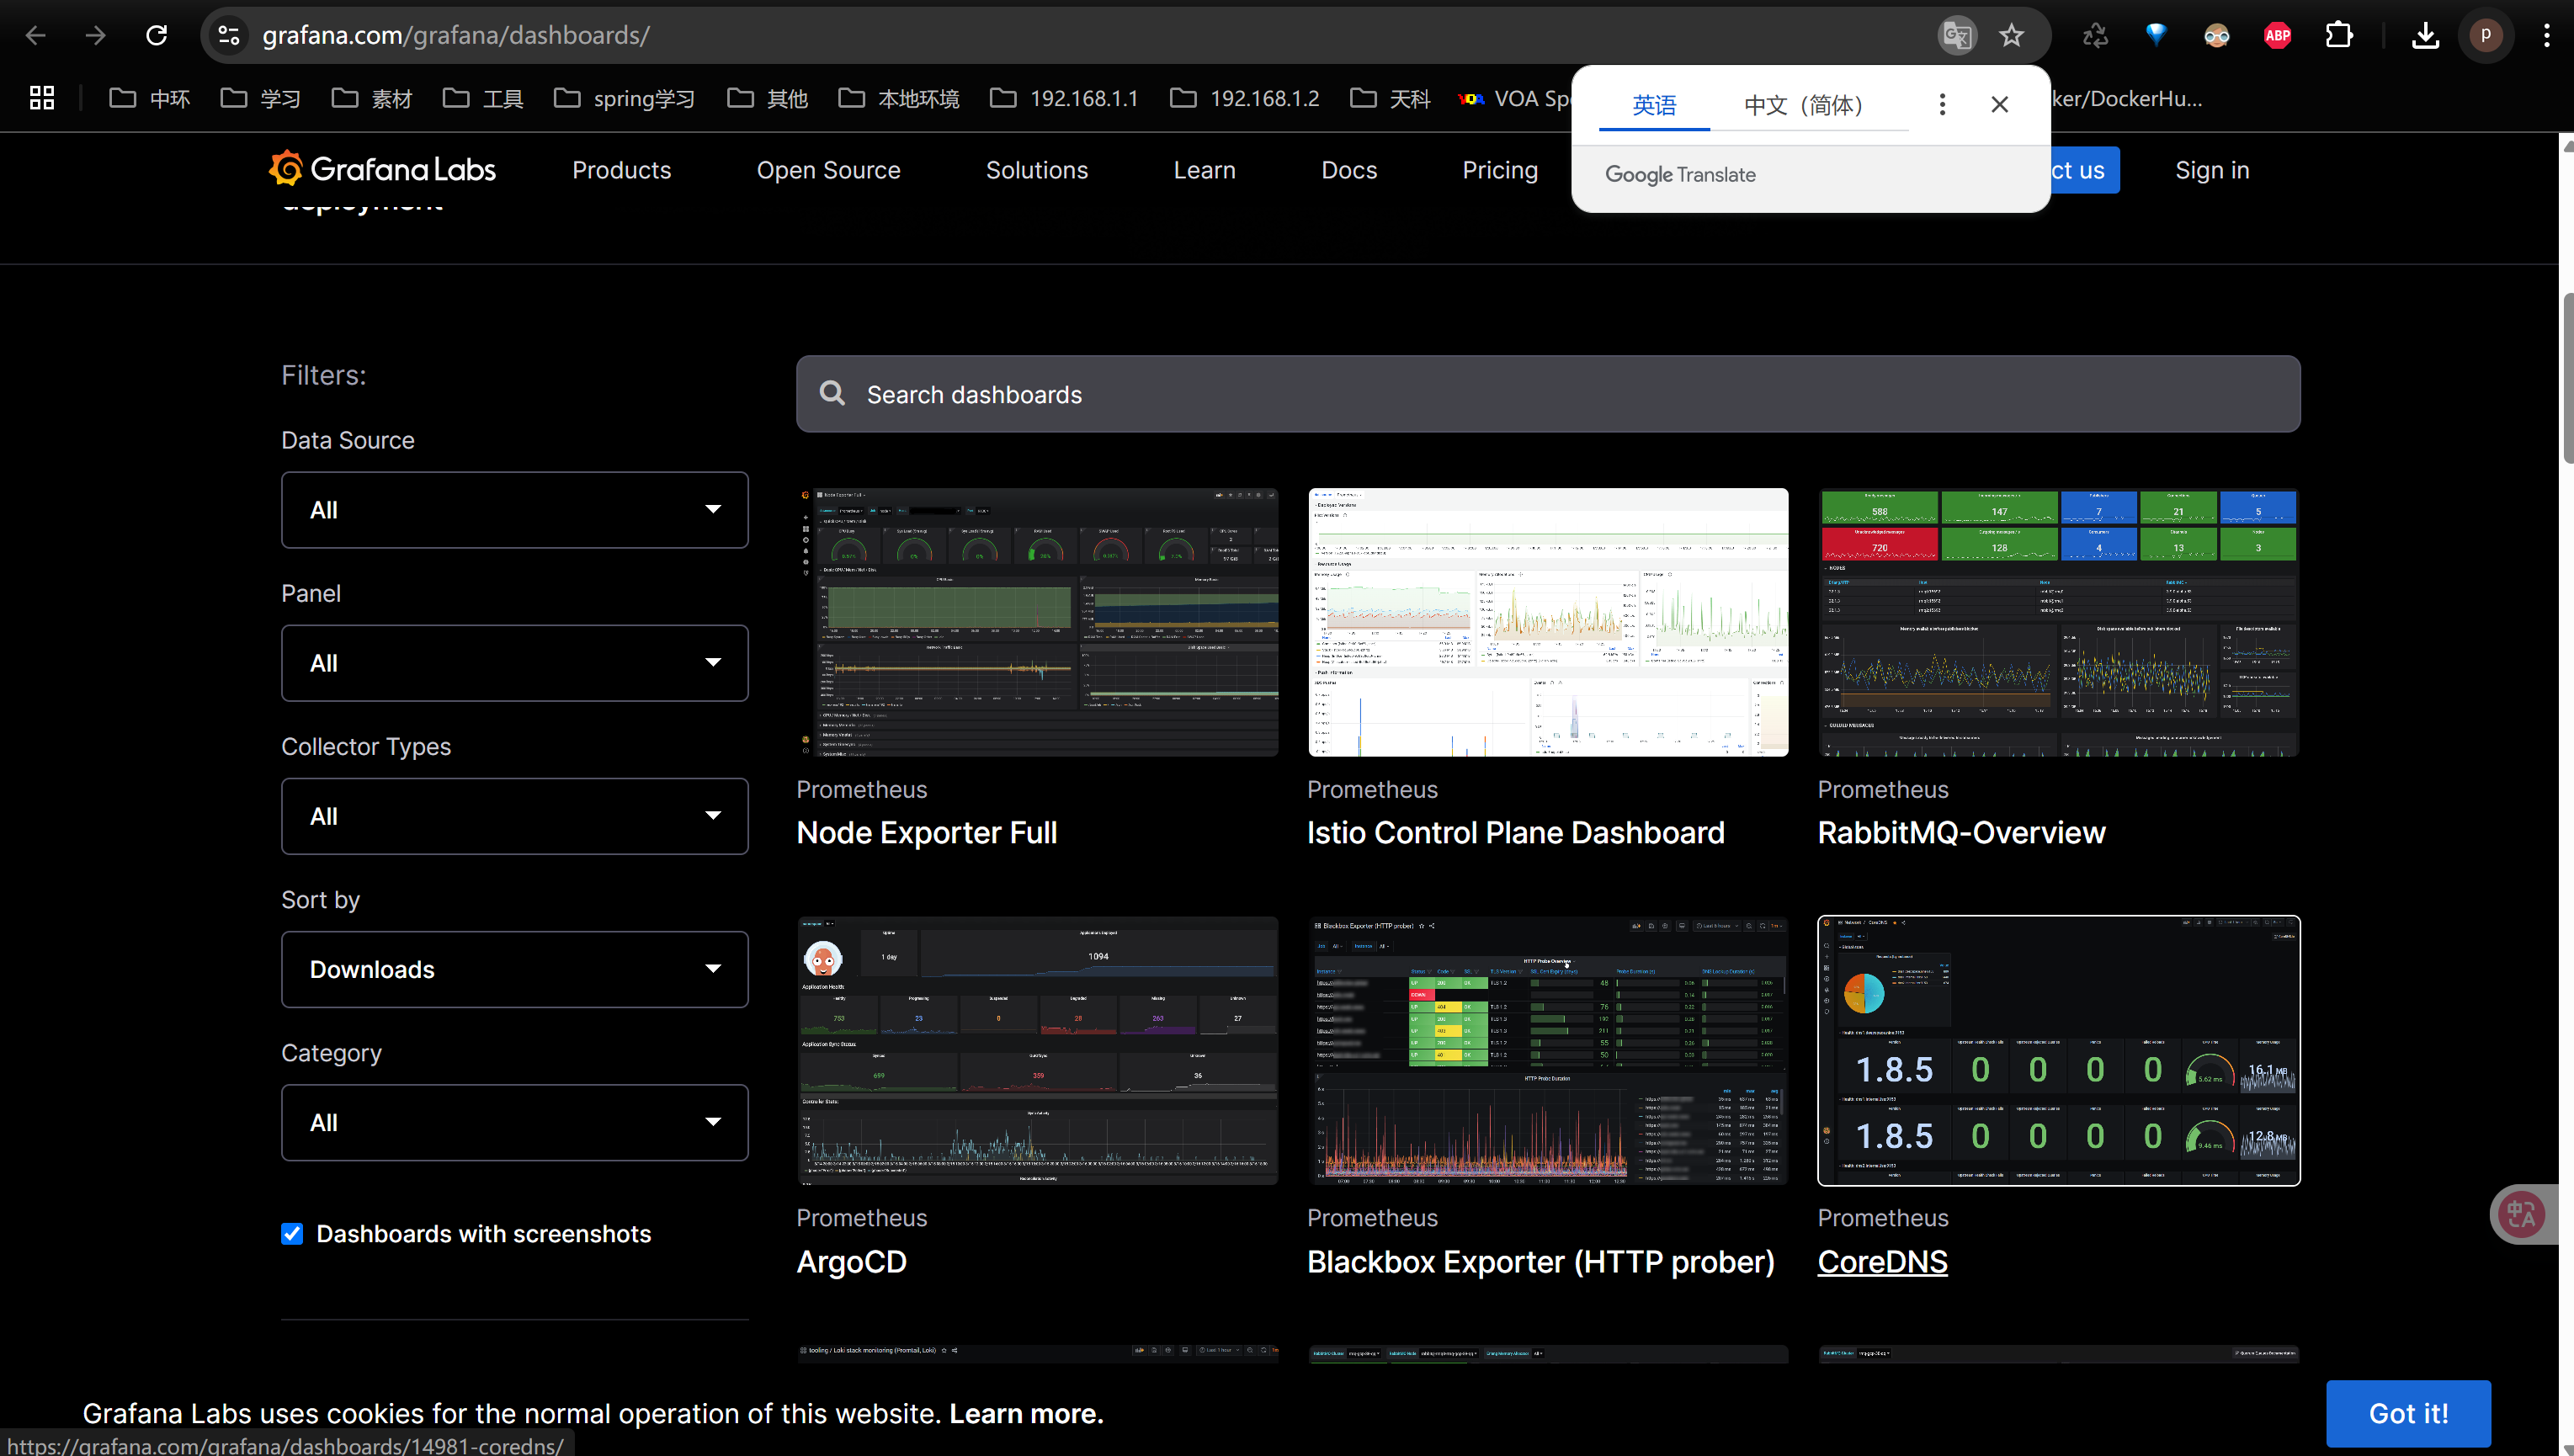
也可以去官网上下载json文件进行导入
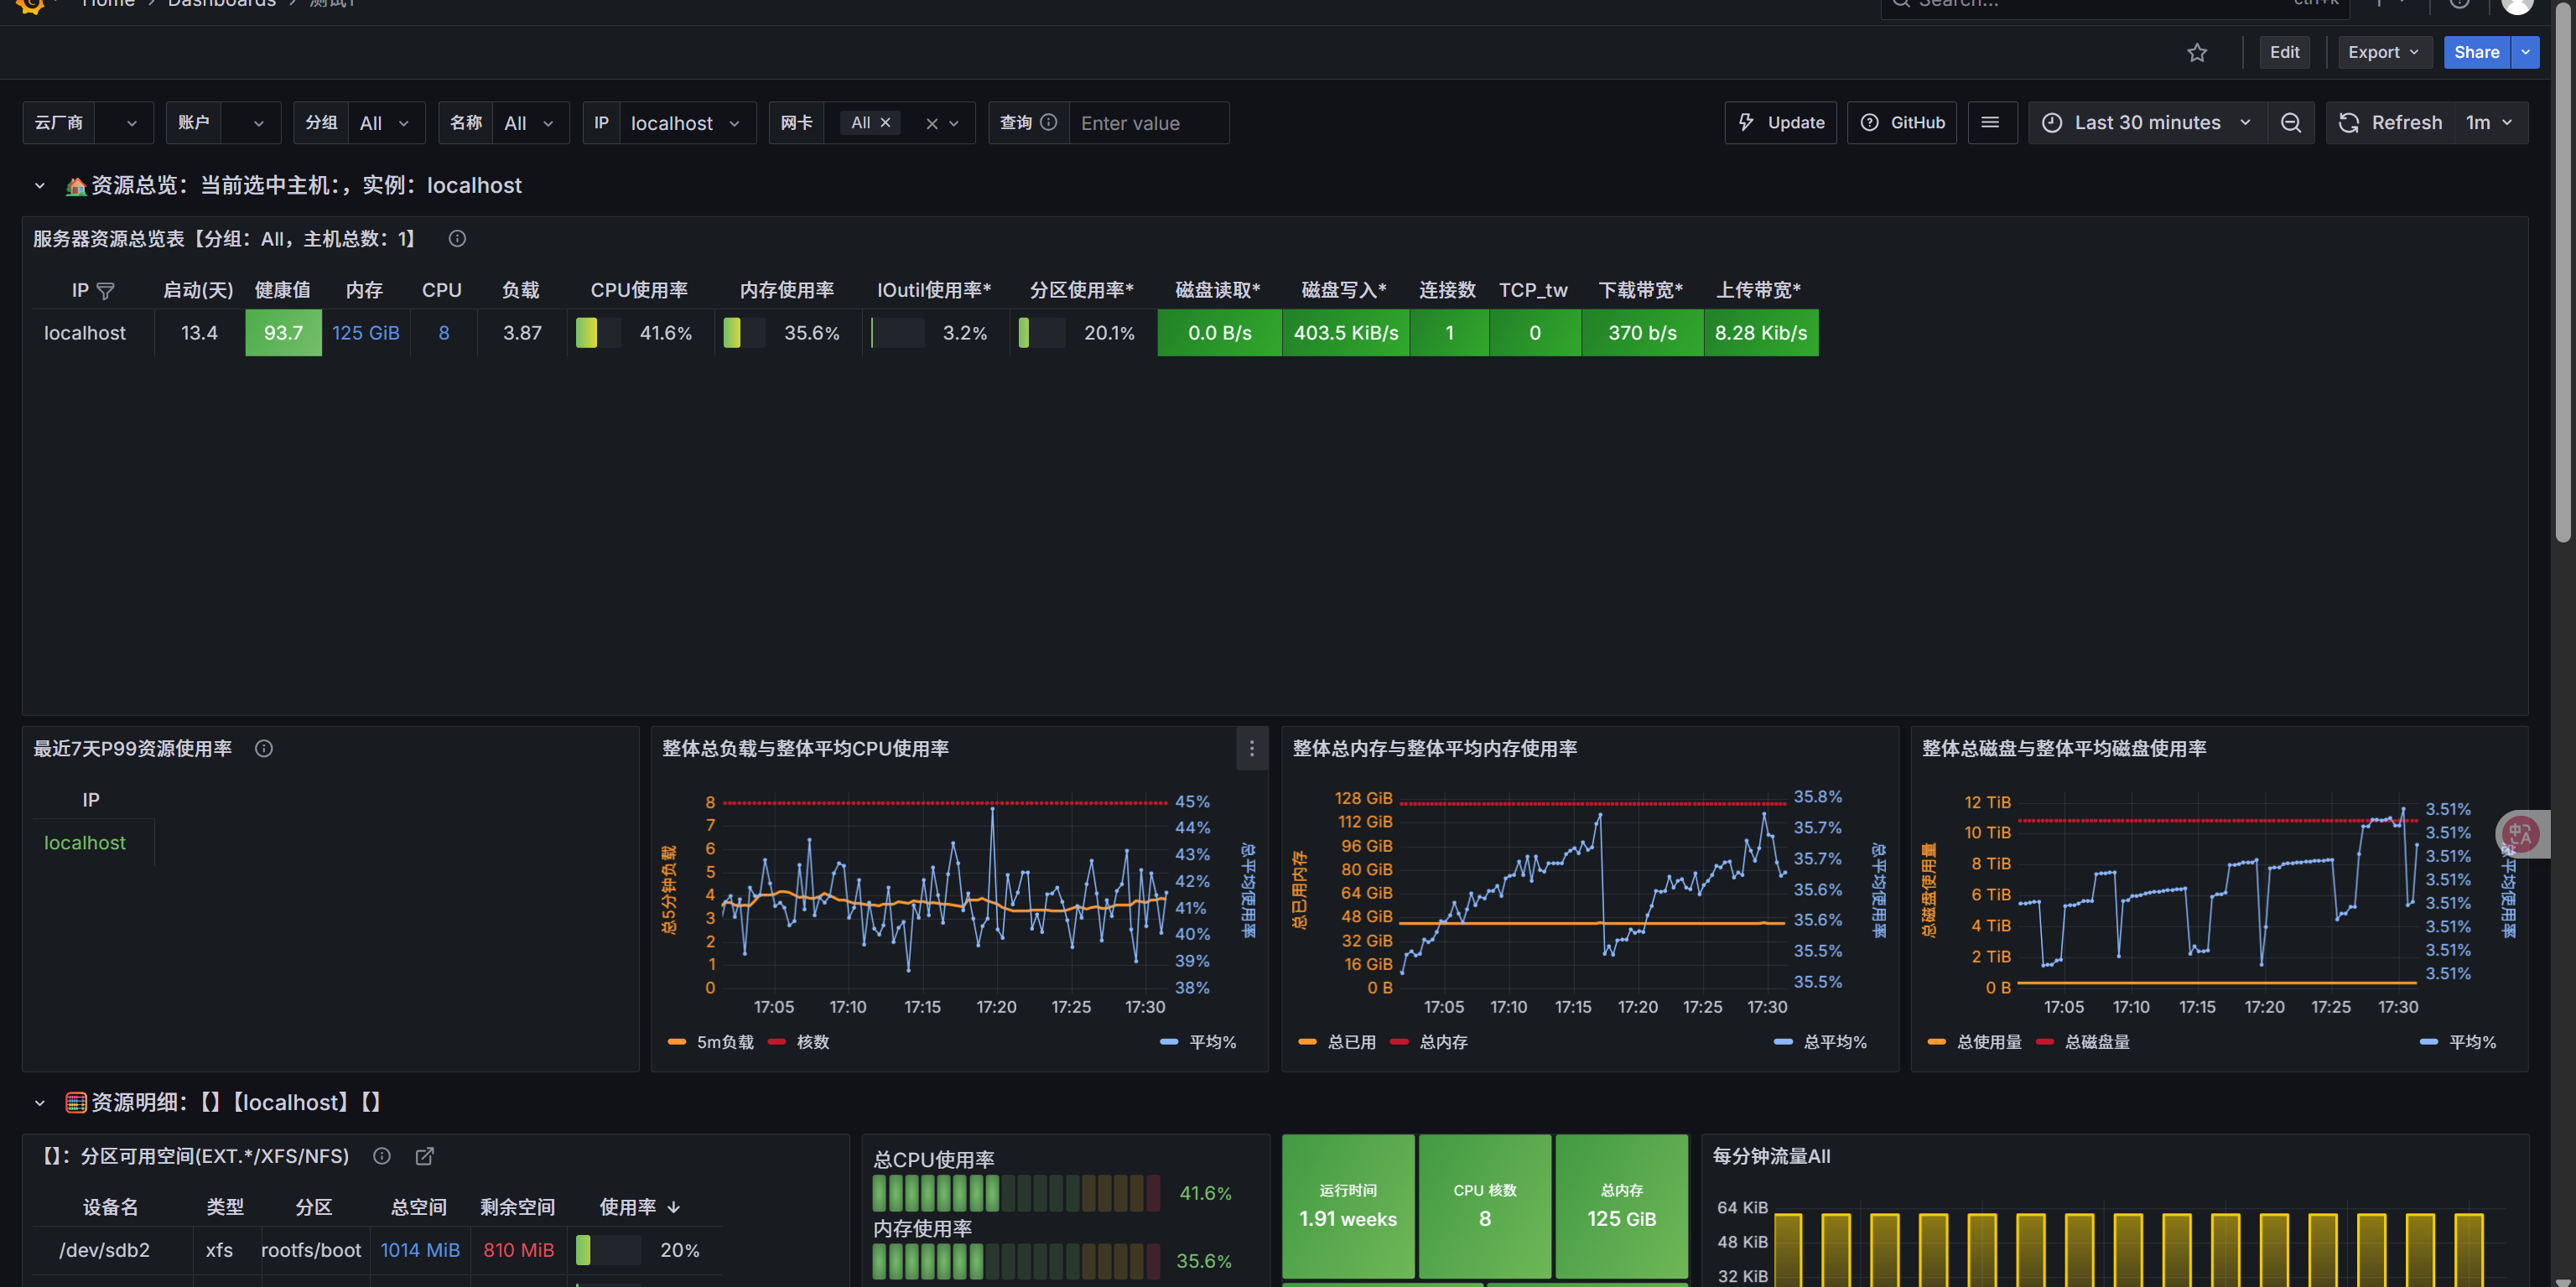
8、创建面板
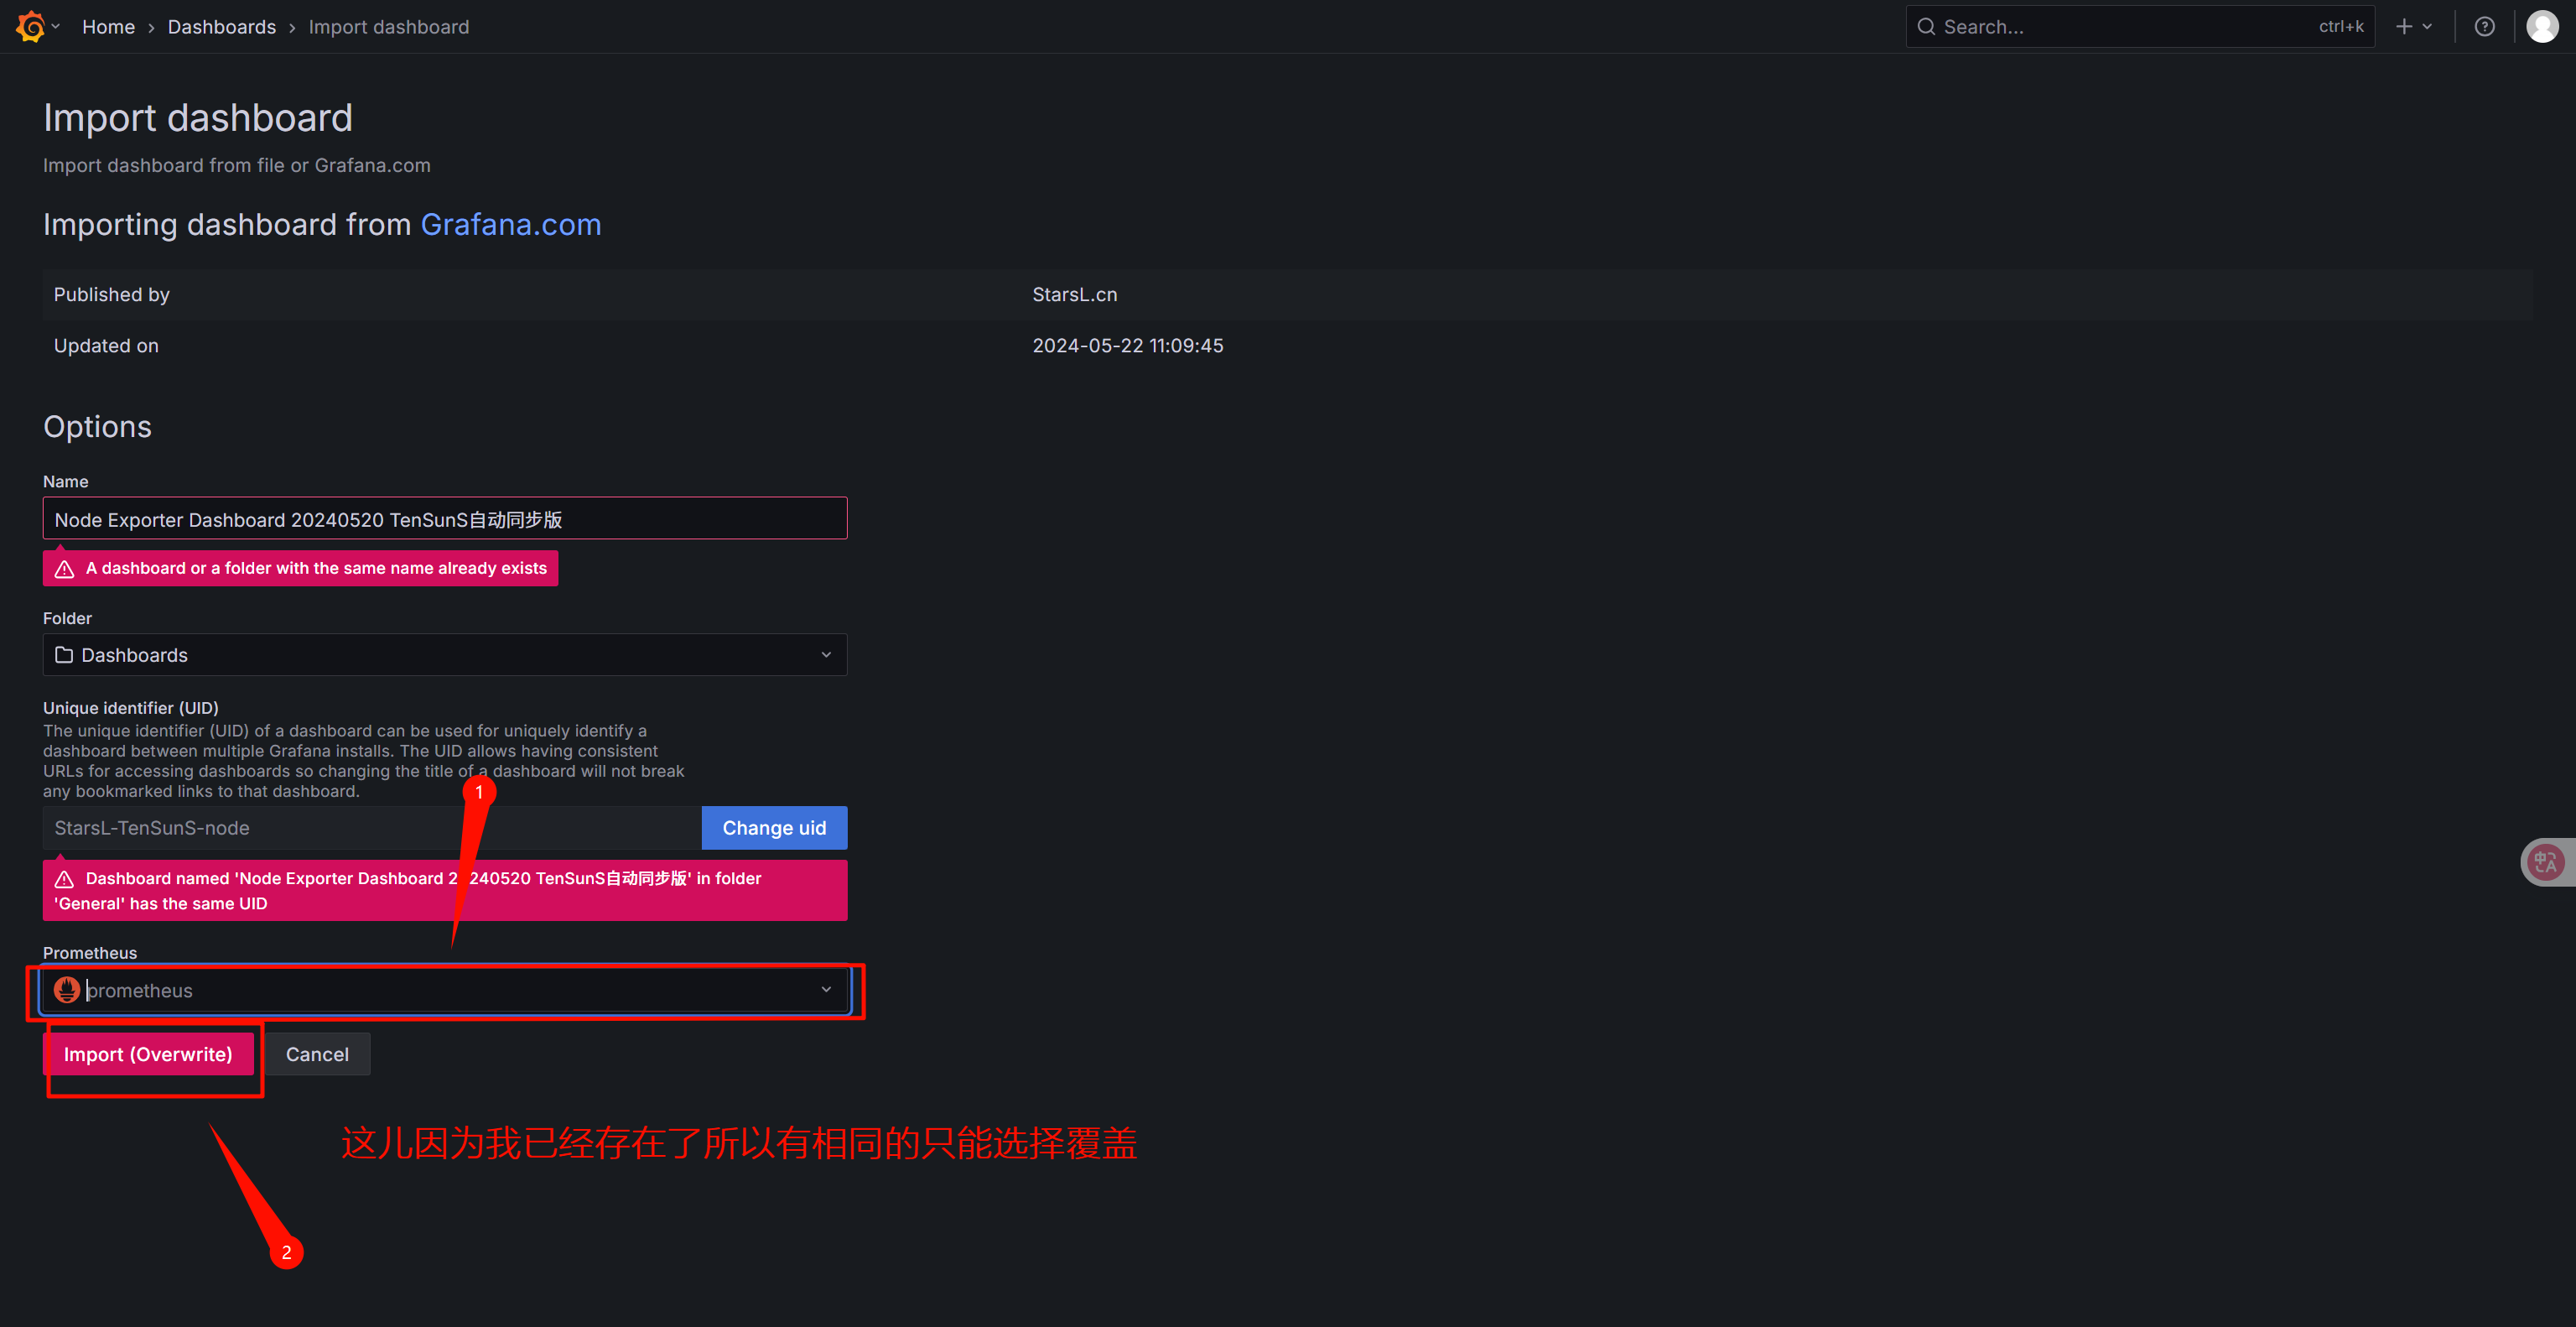
9、成功