用于功能磁共振成像分析和脑部疾病检测的基于扩散增强的自监督图对比学习|文献速递-医学影像人工智能进展
Title
题目
Self-supervised graph contrastive learning with diffusion augmentation forfunctional MRI analysis and brain disorder detection
用于功能磁共振成像分析和脑部疾病检测的基于扩散增强的自监督图对比学习
01
文献速递介绍
静息态功能磁共振成像(rs-fMRI)专注于在不执行特定任务的静息状态下测量低频血氧水平依赖(BOLD)信号,并且已成为神经成像领域的重要工具(希勒(Shirer)等人,2015年;雨宫(Amemiya)等人,2016年)。由静息态功能磁共振成像所描述的功能连接(FC)能够捕捉大脑活动模式以及大脑感兴趣区域(ROI)之间的关系,这越来越多地被用于探究诸如重度抑郁症(MDD)和自闭症谱系障碍(ASD)等脑部疾病的病理机制,并进行自动化诊断(戴(Dai)等人,2023年;内贝尔(Nebel)等人,2022年;毛(Mao)等人,2019年;方(Fang)等人,2023年)。随着机器学习和深度学习的发展,越来越多的技术被开发出来用于功能磁共振成像生物标志物的发现以及脑部疾病的自动化检测(邦迪(Bondi)等人,2023年;侯(Hou)等人,2023年;赫布林·维埃拉(Hebling Vieira)等人,2021年;王(Wang)等人,2024年)。然而,学习模型通常需要大量的带注释样本才能实现良好的泛化性能(因加尔哈利卡尔(Ingalhalikar)等人,2021年;崔(Cui)等人,2023年;王(Wang)等人,2023年;韦纳(Weiner)等人,2013年)。 诸如图对比学习这样的自监督学习为解决这一问题提供了一个很有前景的方案,它无需标注数据,利用自身强大的迁移能力来应对小样本量的问题(费多罗夫(Fedorov)等人,2024年)。图增强通常是图对比学习框架中的一个关键组成部分(德米雷尔(Demirel)和霍尔茨(Holz),2024年)。许多基于功能磁共振成像的对比学习研究专注于使用各种技术(例如,窗口切片和窗口变形)来增强功能磁共振成像时间序列数据,而这可能会破坏原始BOLD信号中嵌入的信息,进而阻碍后续的功能磁共振成像特征提取(王(Wang)等人,2022年;唐(Tang)等人,2022年;比斯特博斯(Bijsterbosch)等人,2017年)。一些最先进的(SOTA)图增强策略,比如自动图对比学习(AutoGCL)(尹(Yin)等人,2022年)和对抗性图对比学习(AD-GCL)(苏雷什(Suresh)等人,2021年)中使用的基于图神经网络(GNN)的方法,由于它们的生成器并非专门为图生成而设计,所以仍然难以生成高质量的样本。作为一种强大的深度生成模型,扩散模型在包括图像合成、分子设计和医学数据分析等各个领域都有着广泛的应用,并且表现出了无与伦比的性能(杨(Yang)等人,2023年;吴(Wu)等人,2024年)。然而,很少有研究探索利用扩散模型来实现基于脑功能连接网络(FCN)的数据增强,并将其与对比学习相结合用于脑部疾病检测。 在本文中,我们提出了一种基于扩散增强的自监督图对比学习框架(GCDA),用于功能磁共振成像分析和脑部疾病检测。GCDA由一个用于学习通用且可迁移的功能磁共振成像特征的“前置任务模型”和一个旨在对前置任务模型进行微调以适应下游任务的“特定任务模型”组成。具体来说,前置任务模型包含三个组件:(1)一个图构建模块,(2)一个图扩散增强(GDA)模块,以及(3)一个图对比学习模块。首先,我们利用图构建模块基于功能磁共振成像数据构建功能连接网络/图。然后,这些图会通过GDA模块,该模块会对图的边和节点进行扰动,从而在能够生成高质量增强图的同时,保持原始BOLD信号的完整性。接着,使用两个具有共享参数的图同构网络(GINs)以自监督对比学习的方式提取通用的功能磁共振成像特征。需要注意的是,前置任务模型是基于未标注的功能磁共振成像数据进行优化的,从而省去了繁琐的标注过程。特定任务模型旨在以有监督的、面向任务的方式调整前置任务模型中经过良好训练的参数,以适应下游任务。我们在两个包含总共1230名受试者的静息态功能磁共振成像数据集上对所提出的GCDA进行了评估,实验结果表明,我们的GCDA在自动诊断两种类型的脑部疾病方面优于几种最先进的方法。 这项工作的主要贡献概述如下: - 开发了一种基于扩散增强的自监督图对比学习框架,用于功能磁共振成像分析和脑部疾病检测,有效地解决了功能磁共振成像研究中的小样本量问题。 - 设计了一种新颖的图扩散增强策略,用于修改脑图中的节点和边特征,这极大地有助于保持原始信号的完整性,并促进有效的功能磁共振成像特征提取。 - 在两个静息态功能磁共振成像数据集上进行的实验表明,与几种最先进的方法相比,我们的方法在脑部疾病诊断方面具有优越性。此外,我们的方法有助于识别功能连接异常以及与疾病相关的脑区,从而为基于功能磁共振成像的脑部疾病临床分析提供了便利。 本文的其余部分组织如下。我们在第2节中回顾了相关研究。在第3节中,我们介绍了研究材料和所提出的方法。在第4节中,我们展示了实验设置和实验结果。在第5节中,我们讨论了所提出方法的几个关键组成部分,以及当前工作的一些局限性。最后,我们在第6节中对本文进行了总结。
Abatract
摘要
Resting-state functional magnetic resonance imaging (rs-fMRI) provides a non-invasive imaging techniqueto study patterns of brain activity, and is increasingly used to facilitate automated brain disorder analysis.Existing fMRI-based learning methods often rely on labeled data to construct learning models, while the dataannotation process typically requires significant time and resource investment. Graph contrastive learningoffers a promising solution to address the small labeled data issue, by augmenting fMRI time series for selfsupervised learning. However, data augmentation strategies employed in these approaches may damage theoriginal blood-oxygen-level-dependent (BOLD) signals, thus hindering subsequent fMRI feature extraction. Inthis paper, we propose a self-supervised graph contrastive learning framework with diffusion augmentation(GCDA) for functional MRI analysis. The GCDA consists of a pretext model and a task-specific model. In thepretext model, we first augment each brain functional connectivity network derived from fMRI through agraph diffusion augmentation (GDA) module, and then use two graph isomorphism networks with sharedparameters to extract features in a self-supervised contrastive learning manner. The pretext model can beoptimized without the need for labeled training data, while the GDA focuses on perturbing graph edges andnodes, thus preserving the integrity of original BOLD signals. The task-specific model involves fine-tuning thetrained pretext model to adapt to downstream tasks. Experimental results on two rs-fMRI cohorts with a totalof 1230 subjects demonstrate the effectiveness of our method compared with several state-of-the-arts.
静息态功能磁共振成像(rs-fMRI)提供了一种非侵入性的成像技术来研究大脑活动模式,并且越来越多地被用于推动脑部疾病的自动化分析。现有的基于功能磁共振成像(fMRI)的学习方法通常依赖于有标签的数据来构建学习模型,然而数据标注过程通常需要投入大量的时间和资源。图对比学习为解决标注数据量少这一问题提供了一个很有前景的解决方案,它通过增强功能磁共振成像时间序列数据来进行自监督学习。 然而,这些方法中所采用的数据增强策略可能会破坏原始的血氧水平依赖(BOLD)信号,从而妨碍后续的功能磁共振成像特征提取。在本文中,我们提出了一种基于扩散增强的自监督图对比学习框架(GCDA),用于功能磁共振成像分析。该GCDA框架由一个“前置任务模型”和一个“特定任务模型”组成。 在前置任务模型中,我们首先通过一个图扩散增强(GDA)模块对从功能磁共振成像数据中得到的每个大脑功能连接网络进行增强,然后使用两个具有共享参数的图同构网络,以自监督对比学习的方式来提取特征。前置任务模型无需有标签的训练数据就可以进行优化,而GDA模块专注于对图的边和节点进行扰动,从而保持了原始BOLD信号的完整性。特定任务模型包括对已训练的前置任务模型进行微调,以适应下游任务。 在两个共包含1230名受试者的静息态功能磁共振成像队列上进行的实验结果表明,与几种最先进的方法相比,我们的方法是有效的。
Method
方法
3.1. Materials and data preprocessing
Two datasets with rs-fMRI scans are used in the experiments, including (1) REST-meta-MDD Consortium (REST-MDD)1 and (2) AutismBrain Imaging Data Exchange (ABIDE).2 For each dataset, we use thetop three largest sites in the experiments. Specifically, the largest siteis utilized to train the pretext model to acquire general fMRI featurerepresentations, and the remaining sites are utilized to fine-tune thepre-trained model. The demographic and category information of thesubjects included in this study is reported in Table 1.
(1) REST-MDD. For the REST-MDD dataset, we choose the threelargest sites to evaluate the proposed model (i.e., Site 20, Site 1, andSite 21). Each site comprises 282 MDD and 251 healthy controls (HCs),74 MDD and 74 HCs, 86 MDD and 70 HCs, respectively. The rs-fMRIdata from Site 20 are gathered by the Faculty of Psychology, SouthwestUniversity, using a Siemens Tim Trio 3T scanner. Each fMRI scan isobtained based on the following imaging parameters: a repetition time(TR) of 2, 000 ms, an echo time (TE) of 30 ms, a voxel size of 3.44 ×3.44×4.00 mm3 , a slice thickness of 3.0 mm, 32 slices, and a flip angle of90𝑜 . The rs-fMRI data in Site 1 are from the National Clinical ResearchCenter for Mental Disorders (Peking University Sixth Hospital) and KeyLaboratory of Mental Health, Ministry of Health (Peking University),acquired using a Siemens Tim Trio 3T MRI scanner. Each fMRI scan isgained based on the following imaging parameters: a TR of 2000 ms,a TE of 30 ms, a voxel size of 3.28 × 3.28 × 4.80 mm3 , a slice thicknessof 4.0 mm, 30 slices, a flip angle of 90𝑜 . The rs-fMRI data from Site 21are from Beijing Anding Hospital, Capital Medical University, collectedusing a Siemens Tim Trio 3T scanner. Each fMRI is obtained as follows:a TR of 2000 ms, a TE of 30 ms, a voxel size of 3.12 × 3.12 × 4.20 mm3 , aslice thickness of 3.5 mm, 33 slices, a flip angle of 90𝑜 .For fMRI preprocessing, the Data Processing Assistant for RestingState fMRI (DPARSF) pipeline is employed. Specifically, the first 10volumes would be excluded to ensure a steady magnetization state,after which slice timing correction is performed. Then, a six-parameter(rigid body) linear transformation is used to realign time series. A 6-degrees-of-freedom linear transformation without resampling is utilizedto co-register individual T1-weighted images to the mean functionalimage, and then segment T1-weighted images into gray matter (GM),white matter (WM), and cerebrospinal fluid (CSF). The DiffeomorphicAnatomical Registration Through Exponentiated Lie algebra (DARTEL)tool is then utilized to calculate transformations from individual nativespace to Montreal Neurological Institute (MNI) space. We also conductnuisance covariates regression (head motion parameters, WM, andCSF) and perform time bandpass filtering (0.01 − 0.10 Hz) on all timeseries. Finally, the brain is partitioned into 116 ROIs according to theAutomated Anatomy Labeling (AAL) atlas, and the average time seriesof each ROI is extracted.
(2) ABIDE. In ABIDE, we use the three sites (i.e., NYU, UM, andLEUVEN), containing 79 ASD and 105 HCs, 68 ASD and 77 HCs, 29ASD and 35 HCs, respectively. The rs-fMRI data from Site NYU arecollected through NYU Langone Medical Center using a 3 T Allegrascanner. The imaging parameters are delineated below: TR = 2000 ms,TE = 15 ms, voxel size = 3.0 × 3.0 × 4.0 mm3 , slice thickness = 4.0 mm,slice number = 33, flip angle = 90𝑜 . The rs-fMRI data from Site UM areacquired at the University of Michigan using a 3 T GE Signa scanner.The imaging information is as follows: TR = 2000 ms, TE = 30 ms,voxel size = 3.438 × 3.438 × 3.000 mm3 , slice thickness = 3.0 mm, slicenumber = 40, flip angle = 90𝑜 . The rs-fMRI data from Site LEUVEN aregathered by the University of Leuven using a 3 T Philips MR scanner.Each MRI scan is acquired below: TR = 1, 667 ms, TE = 33 ms, voxelsize = 3.59 × 3.59 × 4.00 mm3 , slice thickness = 4.0 mm, slice number =32, flip angle = 90𝑜 .
The rs-fMRI data of the three sites are preprocessed based on theDPARSF pipeline, which involves head motion correction, nuisancecovariates regression (ventricle, CSF, WM, and high-order effect of headmotion), spatial normalization of the MNI template, and time-highpassfiltering (0.01 − 0.10 Hz) based on a linear downtrend and fast Fouriertransform. Finally, each brain is segmented into 116 ROIs according tothe AAL atlas, and the average time series for each ROI is extracted.
3.1 材料与数据预处理 实验中使用了两个包含静息态功能磁共振成像(rs-fMRI)扫描数据的数据集,包括:(1)静息态元重度抑郁症联盟(REST-meta-MDD Consortium,简称REST-MDD)数据集1 以及(2)自闭症脑成像数据交换库(Autism Brain Imaging Data Exchange,简称ABIDE)数据集2。对于每个数据集,我们在实验中使用其中规模最大的三个站点的数据。具体而言,最大的站点数据用于训练前置任务模型,以获取通用的功能磁共振成像(fMRI)特征表示,其余站点的数据则用于对预训练模型进行微调。本研究中纳入的受试者的人口统计学信息和类别信息见表1。 (1)REST-MDD数据集:对于REST-MDD数据集,我们选择了三个规模最大的站点来评估所提出的模型(即站点20、站点1和站点21)。每个站点分别包含282名重度抑郁症(MDD)患者和251名健康对照者(HCs)、74名MDD患者和74名HCs、86名MDD患者和70名HCs。站点20的rs-fMRI数据由西南大学心理学部使用西门子Tim Trio 3T扫描仪采集。每次fMRI扫描基于以下成像参数获得:重复时间(TR)为2000毫秒,回波时间(TE)为30毫秒,体素大小为3.44×3.44×4.00立方毫米,层厚为3.0毫米,共32层,翻转角为90度。站点1的rs-fMRI数据来自国家精神心理疾病临床医学研究中心(北京大学第六医院)和卫生部精神卫生学重点实验室(北京大学),使用西门子Tim Trio 3T磁共振扫描仪采集。每次fMRI扫描基于以下成像参数获得:TR为2000毫秒,TE为30毫秒,体素大小为3.28×3.28×4.80立方毫米,层厚为4.0毫米,共30层,翻转角为90度。站点21的rs-fMRI数据来自首都医科大学附属北京安定医院,使用西门子Tim Trio 3T扫描仪采集。每次fMRI扫描的参数如下:TR为2000毫秒,TE为30毫秒,体素大小为3.12×3.12×4.20立方毫米,层厚为3.5毫米,共33层,翻转角为90度。 对于fMRI数据预处理,采用了静息态功能磁共振成像数据处理助手(DPARSF)流程。具体来说,首先会剔除前10个扫描容积以确保达到稳定的磁化状态,然后进行层间时间校正。接着,使用六参数(刚体)线性变换对时间序列进行重定位。采用无重采样的六自由度线性变换将个体的T1加权图像与平均功能图像进行配准,然后将T1加权图像分割为灰质(GM)、白质(WM)和脑脊液(CSF)。随后使用基于指数李代数的微分同胚解剖配准(DARTEL)工具计算从个体原生空间到蒙特利尔神经学研究所(MNI)空间的变换。我们还进行了干扰协变量回归(头部运动参数、白质和脑脊液),并对所有时间序列进行了时间带通滤波(0.01 - 0.10赫兹)。最后,根据自动解剖标记(AAL)图谱将大脑划分为116个感兴趣区域(ROI),并提取每个ROI的平均时间序列。 (2)ABIDE数据集:在ABIDE数据集中,我们使用了三个站点的数据(即纽约大学(NYU)站点、密歇根大学(UM)站点和鲁汶大学(LEUVEN)站点),分别包含79名自闭症谱系障碍(ASD)患者和105名HCs、68名ASD患者和77名HCs、29名ASD患者和35名HCs。纽约大学站点的rs-fMRI数据由纽约大学朗格尼医学中心使用3T Allegra扫描仪采集。成像参数如下:TR = 2000毫秒,TE = 15毫秒,体素大小 = 3.0×3.0×4.0立方毫米,层厚 = 4.0毫米,层数 = 33,翻转角 = 90度。密歇根大学站点的rs-fMRI数据由密歇根大学使用3T GE Signa扫描仪采集。成像信息如下:TR = 2000毫秒,TE = 30毫秒,体素大小 = 3.438×3.438×3.000立方毫米,层厚 = 3.0毫米,层数 = 40,翻转角 = 90度。鲁汶大学站点的rs-fMRI数据由鲁汶大学使用3T飞利浦磁共振扫描仪采集。每次MRI扫描的参数如下:TR = 1667毫秒,TE = 33毫秒,体素大小 = 3.59×3.59×4.00立方毫米,层厚 = 4.0毫米,层数 = 32,翻转角 = 90度。 这三个站点的rs-fMRI数据基于DPARSF流程进行预处理,包括头部运动校正、干扰协变量回归(脑室、脑脊液、白质和头部运动的高阶效应)、MNI模板的空间归一化,以及基于线性下降趋势和快速傅里叶变换的时间高通滤波(0.01 - 0.10赫兹)。最后,根据AAL图谱将每个大脑分割为116个ROI,并提取每个ROI的平均时间序列。
这三个站点的静息态功能磁共振成像(rs-fMRI)数据基于静息态功能磁共振成像数据处理助手(DPARSF)流程进行预处理,该流程包括头部运动校正、干扰协变量回归(脑室、脑脊液、白质以及头部运动的高阶效应)、蒙特利尔神经学研究所(MNI)模板的空间归一化,以及基于线性下降趋势和快速傅里叶变换的时间高通滤波(频率范围为0.01至0.10赫兹)。最后,根据自动解剖标记(AAL)图谱将每个大脑分割为116个感兴趣区域(ROI),并提取每个感兴趣区域的平均时间序列。
Conclusion
结论
This work presents a self-supervised graph contrastive learningframework with diffusion augmentation (GCDA) for functional MRIanalysis. The GCDA comprises a pretext model for pre-training anda task-specific model for fine-tuning. In the pretext model, we firstaugment each brain functional connectivity network derived from fMRIthrough a graph diffusion augmentation module, and then use twograph isomorphism networks with shared parameters to extract features in a self-supervised contrastive learning manner. The task-specificmodel involves adjusting the pre-trained parameters of the pretextmodel to adapt to downstream tasks in a supervised manner. Experimental results on two datasets demonstrate that GCDA is superior toseveral state-of-the-art methods.
这项工作提出了一种基于扩散增强的自监督图对比学习框架(GCDA),用于功能磁共振成像(fMRI)分析。GCDA由一个用于预训练的前置任务模型和一个用于微调的特定任务模型组成。在前置任务模型中,我们首先通过一个图扩散增强模块对从功能磁共振成像数据中得到的每个大脑功能连接网络进行增强,然后使用两个具有共享参数的图同构网络,以自监督对比学习的方式来提取特征。特定任务模型则涉及以有监督的方式调整前置任务模型的预训练参数,使其适应下游任务。在两个数据集上的实验结果表明,GCDA优于几种当前最先进的方法。
Figure
图
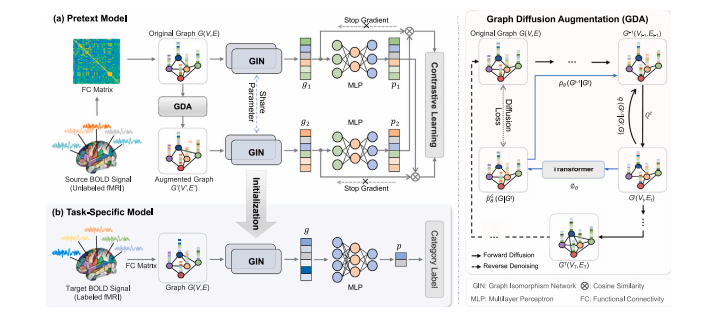
Fig. 1. Illustration of the proposed self-supervised graph contrastive learning framework with diffusion augmentation (GCDA), which consists of (a) a pretext model and (b) atask-specific model. In the pretext model, each FC network is first augmented through a graph diffusion augmentation (GDA) module, followed by two graph isomorphism networks(GINs) for fMRI feature extraction in a self-supervised contrastive learning manner. In the task-specific model, we fine-tune the GIN pre-trained in the pretext model to adapt todownstream disease detection tasks in a supervised task-oriented manner.
图1:所提出的基于扩散增强的自监督图对比学习框架(GCDA)的示意图,该框架由(a)一个“前置任务模型”和(b)一个“特定任务模型”组成。在前置任务模型中,每个功能连接(FC)网络首先通过一个图扩散增强(GDA)模块进行增强,然后由两个图同构网络(GINs)以自监督对比学习的方式进行功能磁共振成像(fMRI)特征提取。在特定任务模型中,我们对在前置任务模型中预训练的GIN进行微调,以有监督的、面向任务的方式使其适应下游的疾病检测任务。
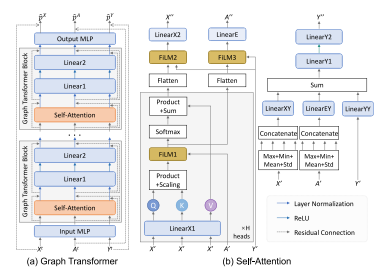
Fig. 2. Details of Graph Transformer network. (a) The overall architecture of the GraphTransformer network. (b) The self-attention module of the Graph Transformer block.𝐹𝑖𝐿𝑀(𝑀*1 ,𝑀2 ) = 𝑀1𝑊1 + (𝑀1𝑊2 ) ⨀𝑀2 + 𝑀2 for learnable weight matrices 𝑊1 and𝑊2 .
图2:图Transformer网络的细节。(a)图Transformer网络的整体架构。(b)图Transformer模块中的自注意力模块。 对于可学习的权重矩阵(W_1)和(W_2),(F_{iLM}(M_1, M_2)=M_1W_1 + (M_1W_2)\bigodot M_2+M_2) 。(注:这里的“(\bigodot)”一般表示按元素相乘的运算,具体含义需根据上下文进一步确定)
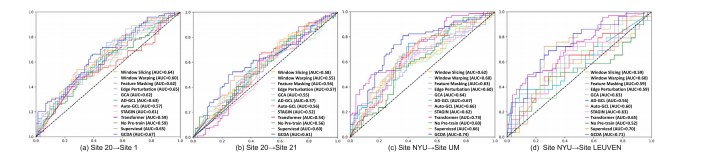
Fig. 3. ROC curves and corresponding AUC values obtained by twelve methods in (a–b) MDD vs. HC classification on REST-MDD and (c–d) ASD vs. HC classification on ABIDE.The horizontal axis is the false positive rate and the vertical axis is the true positive rate.
图3:十二种方法在以下情况中得到的受试者工作特征(ROC)曲线及相应的曲线下面积(AUC)值:(a - b)在REST-MDD数据集上进行的重度抑郁症(MDD)与健康对照者(HC)的分类,以及(c - d)在ABIDE数据集上进行的自闭症谱系障碍(ASD)与健康对照者(HC)的分类。横轴为假阳性率,纵轴为真阳性率。
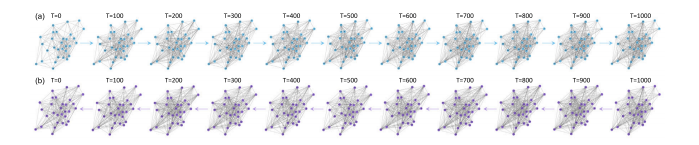
Fig. 4. Visualization of graphs produced by the GDA module at every 100 steps in (a) the forward diffusion process and (b) the reverse denoising process
图4:由图扩散增强(GDA)模块在(a)正向扩散过程和(b)反向去噪过程中每100步所生成的图的可视化展示。
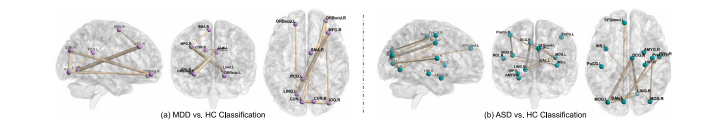
Fig. 5. Visualization of the top 10 discriminative functional connections identified by the proposed GCDA in two classification experiments: (a) MDD vs. HC classification (Site20→Site 1) on REST-MDD, and (b) ASD vs. HC classification (Site NYU→Site UM) on ABIDE.
图5:在两项分类实验中,由所提出的基于扩散增强的自监督图对比学习框架(GCDA)识别出的前10个具有判别性的功能连接的可视化结果:(a)在REST-MDD数据集上进行的重度抑郁症(MDD)与健康对照者(HC)的分类实验(站点20→站点1);(b)在ABIDE数据集上进行的自闭症谱系障碍(ASD)与健康对照者(HC)的分类实验(纽约大学站点→密歇根大学站点)。
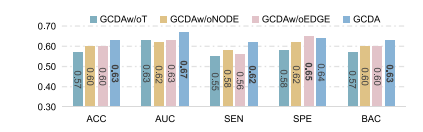
Fig. 6. Results of GCDA and its three variants (i.e., GCDAw/oNODE, GCDAw/oEDGE,and GCDAw/oT) on REST-MDD (i.e., Site 20→Site 1)
图6:基于扩散增强的自监督图对比学习框架(GCDA)及其三个变体(即GCDA无节点操作版本(GCDAw/oNODE)、GCDA无边操作版本(GCDAw/oEDGE)和GCDA无时间相关操作版本(GCDAw/oT))在REST-MDD数据集上(即站点20→站点1)的实验结果。
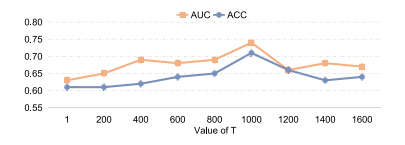
Fig. 7. Results of GCDA with varying diffusion steps (T) on ABIDE (i.e.,Site NYU→Site UM)
图7:具有不同扩散步数(T)的基于扩散增强的自监督图对比学习框架(GCDA)在ABIDE数据集上的实验结果(即纽约大学站点→密歇根大学站点) 。
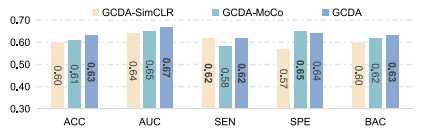
Fig. 8. Performance of GCDA and its two variants (i.e., GCDA-SimCLR and GCDAMoCo with different contrastive learning strategies) in MDD vs. HC classification onREST-MDD (i.e., Site 20→Site 1)..
图8:基于扩散增强的自监督图对比学习框架(GCDA)及其两个变体(即采用不同对比学习策略的GCDA-SimCLR和GCDA-MoCo)在REST-MDD数据集上进行重度抑郁症(MDD)与健康对照者(HC)分类任务(即站点20→站点1)时的性能表现。
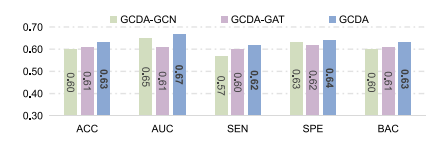
Fig. 9. Performance of GCDA and its two variants (i.e., GCDA-GCN and GCDA-GATwith different feature encoders) in MDD vs. HC classification on REST-MDD (i.e., Site20→Site 1)..
图9:基于扩散增强的自监督图对比学习框架(GCDA)及其两个变体(即采用不同特征编码器的GCDA-图卷积网络(GCDA-GCN)和GCDA-图注意力网络(GCDA-GAT))在REST-MDD数据集上进行重度抑郁症(MDD)与健康对照者(HC)分类(即站点20→站点1)时的性能表现。
Table
表
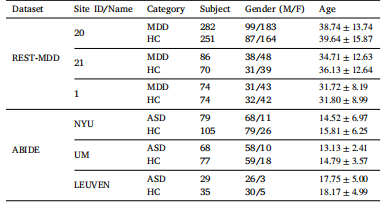
Table 1Demographic information of studied subjects from two datasets. Age is reported asmean ± standard deviation. M/F: Male/Female
表1 来自两个数据集的研究对象的人口统计学信息。年龄以“均值±标准差”的形式呈现。M/F:男性/女性

Table 2Details of fully connected layers in the Graph Transformer. 𝑋𝑖 , 𝐸𝑖 , 𝑌𝑖 (𝑖=1,2): The 𝑖th fully connected operation performed on the node features, edge features, and global featuresin the input and output MLPs. 𝑊 𝑖 (𝑖=1,2): 𝑖th fully connected operation in the FiLM layers
表2 图Transformer中全连接层的详细信息。(X_i)、(E_i)、(Y_i)((i = 1, 2)):对输入和输出多层感知机(MLP)中的节点特征、边特征和全局特征执行的第(i)次全连接操作。(W^i)((i = 1, 2)):特征线性调制(FiLM)层中的第(i)次全连接操作。
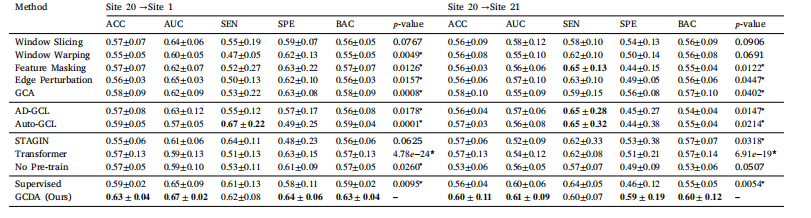
Table 3Results of MDD vs. HC classification experiments on the REST-MDD dataset using twelve methods (shown as mean±standard deviation), highlighting the best results in bold. Thenotation ‘‘S→T’’ indicates that a model is pre-trained on a source domain (Site 20) and fine-tuned on a target domain (Site 1 or Site 21). ‘‘∗’’ denotes a statistically significantdifference between GCDA and a competing method.
表3 使用十二种方法在REST-MDD数据集上进行重度抑郁症(MDD)与健康对照者(HC)分类实验的结果(以均值±标准差的形式呈现),将最佳结果用粗体标出。符号“S→T”表示一个模型在源域(站点20)上进行预训练,然后在目标域(站点1或站点21)上进行微调。“∗”表示GCDA与竞争方法之间存在统计学上的显著差异。
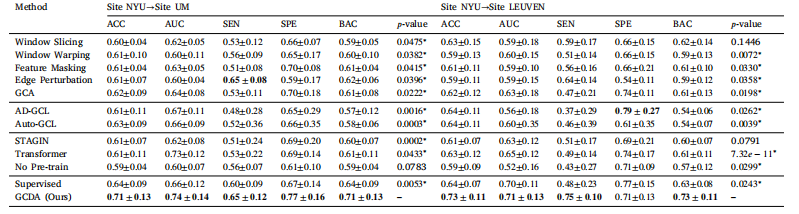
Table 4Results of ASD vs. HC classification experiments on the ABIDE dataset using twelve methods (shown as mean±standard deviation), highlighting the best results in bold. The notation‘‘S→T’’ indicates that a model is pre-trained on a source domain (Site NYU) and fine-tuned on a target domain (Site UM or Site LEUVEN). ‘‘∗’’ denotes a statistically significantdifference between GCDA and a competing method
表4 使用十二种方法在ABIDE数据集上进行自闭症谱系障碍(ASD)与健康对照者(HC)分类实验的结果(以均值±标准差的形式呈现),将最佳结果以粗体显示。符号“S→T”表示一个模型在源域(纽约大学站点)上进行预训练,然后在目标域(密歇根大学站点或鲁汶大学站点)上进行微调。“∗”表示基于扩散增强的自监督图对比学习框架(GCDA)与其他竞争方法之间存在统计学上的显著差异。
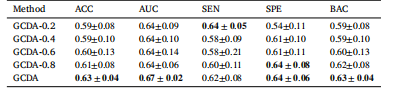
Table 5Influence of different trade-off parameters on GCDA for classifying MDD vs. HC onREST-MDD (i.e., Site 20 →Site 1), highlighting the best results in bold
表5 不同权衡参数对基于扩散增强的自监督图对比学习框架(GCDA)在REST-MDD数据集上进行重度抑郁症(MDD)与健康对照者(HC)分类(即站点20→站点1)时的影响,将最佳结果以粗体显示 。
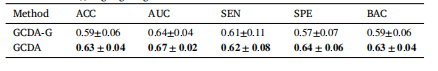
Table 6Performance of GCDA and GCDA-G in MDD vs. HC classification on REST-MDD (i.e.,
Site 20 →Site 1), highlighting the best results in bold.
表6:基于扩散增强的自监督图对比学习框架(GCDA)和GCDA-G在REST-MDD数据集上进行重度抑郁症(MDD)与健康对照者(HC)分类任务(即从站点20到站点1)时的性能表现,其中最佳结果以粗体突出显示。
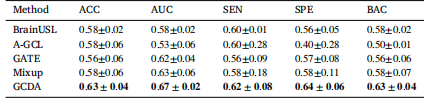
Table 7Performance of GCDA and four recent state-of-the-art fMRI analysis methods in MDDvs. HC classification on the REST-MDD dataset (i.e., Site 20 →Site 1), with best resultsshown in bold
表7 基于扩散增强的自监督图对比学习框架(GCDA)以及四种近期最先进的功能磁共振成像(fMRI)分析方法在REST-MDD数据集上进行重度抑郁症(MDD)与健康对照者(HC)分类(即站点20→站点1)时的性能表现,最佳结果以粗体显示。
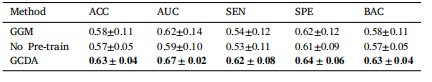
Table 8Performance of GGM, No Pre-train, and GCDA in MDD vs. HC classification on theREST-MDD dataset.
表8:高斯图模型(GGM)、无预训练模型(No Pre-train)以及基于扩散增强的自监督图对比学习框架(GCDA)在REST-MDD数据集上进行重度抑郁症(MDD)与健康对照者(HC)分类任务时的性能表现。