【echarts】堆叠柱形图
主要功能
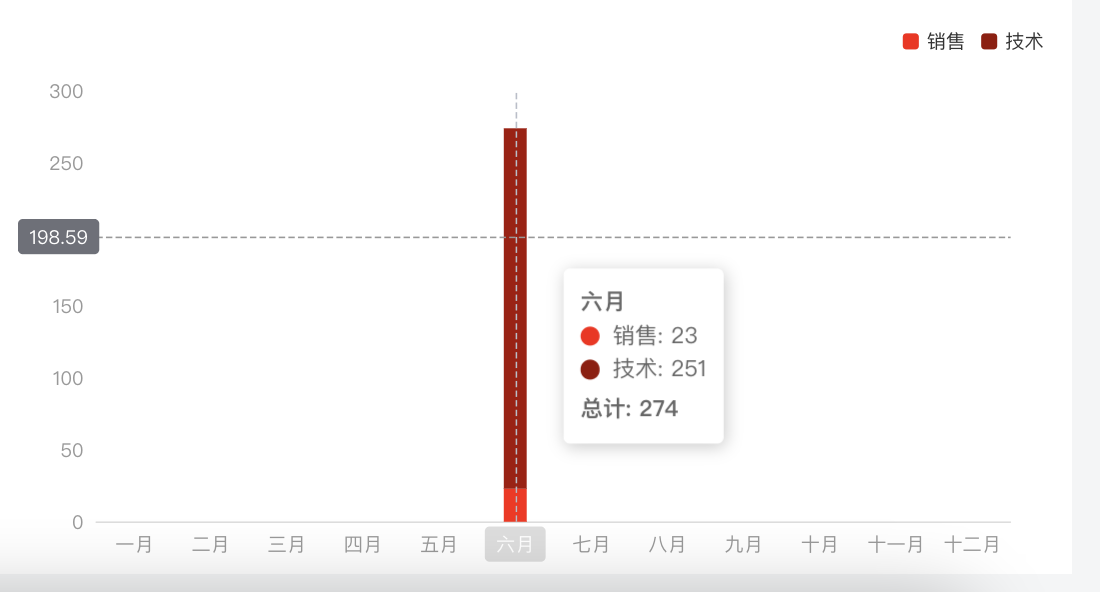
- 数据可视化:以堆叠柱形图形式展示两组数据(销售和技术)的月度分布情况。
- 响应式设计:图表会根据窗口大小自动调整。
- 数据交互:鼠标悬停时显示详细数据(包括每项的具体数值和总计)。
- 数据更新:当传入的 props 数据变化时,图表会自动更新。
组件代码
<template><div class="chart-container" ref="chartRef"></div>
</template><script setup>
import { ref, onMounted, watch } from "vue";
import * as echarts from "echarts";const props = defineProps({// 接收秘密和机密数据secretData: {type: Array,default: () => [],},confidentialData: {type: Array,default: () => [],},// 可选:自定义标题title: {type: String,default: "堆叠柱形图",},// 可选:自定义x轴标签xAxisLabels: {type: Array,default: () => ["一月","二月","三月","四月","五月","六月","七月","八月","九月","十月","十一月","十二月",],},
});const chartRef = ref(null);
let chartInstance = null;// 初始化图表
const initChart = () => {if (!chartRef.value) return;chartInstance = echarts.init(chartRef.value);const option = {backgroundColor: "#fff",title: {text: props.title,left: "center",textStyle: {color: "#333",fontSize: 16,},},tooltip: {trigger: "axis",axisPointer: {type: "cross",crossStyle: {color: "#999",},},formatter: (params) => {let result = `<div class="font-bold">${params[0].name}</div>`;let total = 0;params.forEach((param) => {total += param.value;result += `<div class="flex items-center"><span class="inline-block w-3 h-3 rounded-full mr-2" style="background-color: ${param.color}"></span>${param.seriesName}: ${param.value}</div>`;});result += `<div class="font-bold mt-1">总计: ${total}</div>`;return result;},},legend: {data: ["销售", "技术"],top: "5%",right: "0",itemWidth: 10,itemHeight: 10,},grid: {left: "3%",right: "4%",bottom: "3%",containLabel: true,},xAxis: {type: "category",data: props.xAxisLabels,axisTick: false,axisLabel: {color: "#999999",},axisLine: {show: true, // 显示轴线lineStyle: {color: "#DDDDDD", // 轴线颜色width: 1, // 轴线宽度type: "solid", // 轴线样式:solid, dashed, dotted},},},yAxis: {type: "value",min: 0,axisLabel: {formatter: "{value}",color: "#999999",},splitLine: {show: false, // 隐藏y轴横线(网格线)},},series: [{name: "销售",type: "bar",stack: "总量",data: props.secretData,color: "#FC1705",barWidth: "30%",},{name: "技术",type: "bar",stack: "总量",data: props.confidentialData,color: "#970E02",barWidth: "30%",},],};chartInstance.setOption(option);// 监听窗口大小变化,调整图表window.addEventListener("resize", () => {if (chartInstance) chartInstance.resize();});
};// 初始化和更新图表
onMounted(() => {initChart();
});// 监听props变化,更新图表
watch([() => props.secretData, () => props.confidentialData], () => {if (chartInstance) {chartInstance.setOption({series: [{data: props.secretData,},{data: props.confidentialData,},],});}
});// 组件卸载时销毁图表
onUnmounted(() => {if (chartInstance) {chartInstance.dispose();chartInstance = null;}
});
</script><style scoped>
.chart-container {width: 100%;height: 360px;margin: 0 auto;
}
</style>
组件引用
<StackedBarChart:secretData="[0, 0, 0, 0, 0, 23, 0, 0, 0, 0, 0, 0]":confidentialData="[0, 0, 0, 0, 0, 251, 0, 0, 0, 0, 0, 0]"
/>
本文来自互联网用户投稿,该文观点仅代表作者本人,不代表本站立场。本站仅提供信息存储空间服务,不拥有所有权,不承担相关法律责任。如若转载,请注明出处:http://www.dtcms.com/a/231523.html
如若内容造成侵权/违法违规/事实不符,请联系邮箱:809451989@qq.com进行投诉反馈,一经查实,立即删除!