在RK3588上搭建ROS1环境:创建节点与数据可视化实战指南
在RK3588上搭建ROS1环境:创建节点与数据可视化实战指南
- 背景介绍
- 完整操作步骤
- 1. 创建Docker容器环境
- 2. 验证GUI显示功能
- 3. 安装ROS Noetic
- 4. 配置环境变量
- 5. 创建ROS节点(小球运动模拟)
- 6. 配置RVIZ默认视图
- 7. 创建启动脚本
- 8. 运行可视化系统
- 效果展示与交互
- 技术解析
- ROS节点通信架构
- 运动模型原理
- 性能优化技巧
- 应用场景扩展
- 总结
背景介绍
机器人操作系统(ROS)是机器人开发领域的核心框架,它提供了一系列工具和库来简化复杂机器人系统的构建。在嵌入式平台如RK3588上运行ROS具有重要实际意义,因为它能让我们在资源受限的设备上实现复杂的机器人功能。
本文将详细介绍如何在RK3588开发板上:
- 使用Docker容器化环境安装ROS1(Noetic)
- 创建模拟场景节点(小球绕圆柱运动)
- 实现多模态数据可视化(点云、标记、图像)
- 使用RVIZ进行实时数据展示
这种容器化ROS开发方法不仅适用于RK3588,也可用于其他嵌入式平台,为机器人开发提供了可靠的环境隔离和部署便利性。
完整操作步骤
1. 创建Docker容器环境
在嵌入式开发中使用Docker容器有三大优势:
- 环境隔离:避免污染主机系统
- 可移植性:环境可轻松迁移到其他设备
- 依赖管理:简化复杂依赖的安装过程
创建启动脚本:
cat> run_ros.sh <<-'EOF'
#!/bin/bash
image_name="ubuntu:20.04"
echo $image_name
container_name="ros_rk3588"
if [ $(docker ps -a -q -f name=^/${container_name}$) ]; thenecho "容器 '$container_name' 已经存在。"
elseecho "容器 '$container_name' 不存在。正在创建..."docker run -id --privileged --net=host \-v /etc/localtime:/etc/localtime:ro \-v $PWD:/home -e DISPLAY=$DISPLAY -w /home \-v /tmp/.X11-unix:/tmp/.X11-unix \-e GDK_SCALE -e GDK_DPI_SCALE \--name $container_name --hostname=$container_name $image_name /bin/bash
fi
docker start $container_name
docker exec -ti $container_name bash
EOF
2. 验证GUI显示功能
bash run_ros.sh  # 进入容器
apt update
apt install x11-apps -y  # 安装基础图形工具
xclock  # 测试GUI显示
成功运行xclock并看到时钟界面,说明Docker的GUI转发配置正确。
3. 安装ROS Noetic
ROS Noetic是最后一个支持Python2的ROS1版本,兼容性好:
# 添加ROS软件源
apt install lsb-core -y
sh -c 'echo "deb http://packages.ros.org/ros/ubuntu $(lsb_release -sc) main" > /etc/apt/sources.list.d/ros-latest.list'# 安装必要工具
apt install curl vim -y# 添加ROS密钥
curl -s https://raw.githubusercontent.com/ros/rosdistro/master/ros.asc | apt-key add -# 安装ROS完整桌面版
apt update -y
apt install ros-noetic-desktop-full -y# 安装开发工具
apt install python3-rosdep python3-rosinstall python3-rosinstall-generator python3-wstool build-essential -y# 安装Python依赖
apt install python3.8 pip -y
pip3 install opencv-python==4.11.0.86 -i https://mirrors.aliyun.com/pypi/simple/# 初始化ROS依赖系统
rosdep init
rosdep update
4. 配置环境变量
确保每次启动时自动加载ROS环境:
echo "source /opt/ros/noetic/setup.bash" >> ~/.bashrc
echo "127.0.0.1       ros_rk3588" >> /etc/hosts
5. 创建ROS节点(小球运动模拟)
cat > v2x_node_top_view.py <<-'EOF'
import rospy
import numpy as np
from sensor_msgs.msg import PointCloud2, Image as ImageRos
from visualization_msgs.msg import Marker, MarkerArray
from cv_bridge import CvBridge
import math
import cv2
from sensor_msgs.msg import Image,PointCloud2,Imu
from std_msgs.msg import Header
import sensor_msgs.point_cloud2 as pcl2# 生成圆柱点云
def generate_cylinder(center_x, center_y, radius, height, num_points=500):points = []for _ in range(num_points):# 随机角度和高度theta = np.random.uniform(0, 2*np.pi)h = np.random.uniform(0, height)# 计算点坐标x = center_x + radius * np.cos(theta)y = center_y + radius * np.sin(theta)z = h# 添加到点云 (x,y,z + 强度)points.append([x, y, z, 0.0])return np.array(points, dtype=np.float32)# 创建可视化Marker
def create_cylinder_marker(center_x, center_y, height, radius, id_num, frame_id="map"):marker = Marker()marker.header.frame_id = frame_idmarker.header.stamp = rospy.Time.now()marker.ns = "cylinders"marker.id = id_nummarker.type = Marker.CYLINDERmarker.action = Marker.ADD# 位置和尺寸marker.pose.position.x = center_xmarker.pose.position.y = center_ymarker.pose.position.z = height/2  # 中心位于半高marker.pose.orientation.w = 1.0marker.scale.x = radius * 2marker.scale.y = radius * 2marker.scale.z = height# 颜色 (RGBA)marker.color.r = 0.0marker.color.g = 1.0marker.color.b = 0.0marker.color.a = 0.5  # 半透明marker.lifetime = rospy.Duration()return markerdef create_ball_marker(x, y, z, id_num, frame_id="map"):marker = Marker()marker.header.frame_id = frame_idmarker.header.stamp = rospy.Time.now()marker.ns = "ball"marker.id = id_nummarker.type = Marker.SPHEREmarker.action = Marker.ADD# 位置和尺寸marker.pose.position.x = xmarker.pose.position.y = ymarker.pose.position.z = zmarker.pose.orientation.w = 1.0marker.scale.x = 0.2  # 直径marker.scale.y = 0.2marker.scale.z = 0.2# 颜色 (RGBA)marker.color.r = 1.0marker.color.g = 0.0marker.color.b = 0.0marker.color.a = 1.0marker.lifetime = rospy.Duration()return marker# 创建顶视图摄像头图像
def create_top_view_image(cylinder1, cylinder2, ball_pos, ball_history, img_width=640, img_height=480):# 创建白色背景image = np.ones((img_height, img_width, 3), dtype=np.uint8) * 255# 定义坐标映射参数scale = 100  # 缩放比例offset_x = img_width // 2offset_y = img_height // 2# 将3D坐标转换为2D图像坐标 (顶视图)def project_to_2d(x, y):u = int(offset_x + x * scale)v = int(offset_y + y * scale)return u, v# 绘制坐标轴cv2.line(image, (offset_x, 0), (offset_x, img_height), (200, 200, 200), 1)cv2.line(image, (0, offset_y), (img_width, offset_y), (200, 200, 200), 1)cv2.putText(image, "X", (img_width - 20, offset_y - 10), cv2.FONT_HERSHEY_SIMPLEX, 0.5, (0, 0, 0), 1)cv2.putText(image, "Y", (offset_x + 10, 20), cv2.FONT_HERSHEY_SIMPLEX, 0.5, (0, 0, 0), 1)# 绘制网格grid_size = 1.0  # 网格间距for i in range(-5, 6):# 水平线y_pos = i * grid_size_, v = project_to_2d(0, y_pos)cv2.line(image, (0, v), (img_width, v), (220, 220, 220), 1)# 垂直线x_pos = i * grid_sizeu, _ = project_to_2d(x_pos, 0)cv2.line(image, (u, 0), (u, img_height), (220, 220, 220), 1)# 网格标签if i != 0:cv2.putText(image, f"{y_pos:.1f}", (offset_x + 5, v - 5), cv2.FONT_HERSHEY_SIMPLEX, 0.4, (100, 100, 100), 1)cv2.putText(image, f"{x_pos:.1f}", (u + 5, offset_y + 15), cv2.FONT_HERSHEY_SIMPLEX, 0.4, (100, 100, 100), 1)# 绘制圆柱1 (顶视图为圆形)cx, cy = project_to_2d(cylinder1[0], cylinder1[1])radius = int(cylinder1[3] * scale)cv2.circle(image, (cx, cy), radius, (0, 180, 0), -1)cv2.circle(image, (cx, cy), radius, (0, 100, 0), 2)# 绘制圆柱2cx, cy = project_to_2d(cylinder2[0], cylinder2[1])radius = int(cylinder2[3] * scale)cv2.circle(image, (cx, cy), radius, (0, 180, 0), -1)cv2.circle(image, (cx, cy), radius, (0, 100, 0), 2)# 绘制8字形轨迹if len(ball_history) > 1:for i in range(1, len(ball_history)):x1, y1 = ball_history[i-1]x2, y2 = ball_history[i]u1, v1 = project_to_2d(x1, y1)u2, v2 = project_to_2d(x2, y2)# 绘制轨迹线cv2.line(image, (u1, v1), (u2, v2), (200, 200, 255), 2)# 绘制小球轨迹点for pos in ball_history:u, v = project_to_2d(pos[0], pos[1])cv2.circle(image, (u, v), 2, (100, 100, 255), -1)# 绘制当前小球位置bx, by = project_to_2d(ball_pos[0], ball_pos[1])radius = int(0.2 * scale)cv2.circle(image, (bx, by), radius, (0, 0, 255), -1)cv2.circle(image, (bx, by), radius, (100, 0, 0), 2)# 添加标题和说明cv2.putText(image, "Top View: Ball Moving in Figure-8 Pattern", (10, 30),cv2.FONT_HERSHEY_SIMPLEX, 0.7, (0, 0, 0), 2)cv2.putText(image, "Red Ball: Current Position", (10, img_height - 30),cv2.FONT_HERSHEY_SIMPLEX, 0.5, (0, 0, 255), 1)cv2.putText(image, "Pink Line: Movement Path", (10, img_height - 10),cv2.FONT_HERSHEY_SIMPLEX, 0.5, (200, 100, 255), 1)# 添加比例尺scale_length = 1.0  # 1米u1, v1 = project_to_2d(-4.5, -4.0)u2, v2 = project_to_2d(-4.5 + scale_length, -4.0)cv2.line(image, (u1, v1), (u2, v2), (0, 0, 0), 2)cv2.putText(image, "1m", (u1 + 10, v1 - 5), cv2.FONT_HERSHEY_SIMPLEX, 0.5, (0, 0, 0), 1)return imageclass PcPublisher:def __init__(self, publisher_name = "kitti_pcl", queue_size = 10) -> None:self.pcl_pub=rospy.Publisher(publisher_name, PointCloud2, queue_size=queue_size)def publish(self, point_cloud):header=Header()header.stamp=rospy.Time.now()header.frame_id="map"self.pcl_pub.publish(pcl2.create_cloud_xyz32(header,point_cloud[:,:3]))def main():rospy.init_node('v2x_node', anonymous=True)# 创建发布器pcl_pub = PcPublisher('v2x_pcl', queue_size=10)marker_pub = rospy.Publisher('v2x_markers', MarkerArray, queue_size=10)image_pub = rospy.Publisher('v2x_top_view', ImageRos, queue_size=10)bridge = CvBridge()# 圆柱参数cylinder_height = 2.0cylinder_radius = 0.5cylinder1_pos = (1.0, 0.0, cylinder_height, cylinder_radius)  # (x, y, height, radius)cylinder2_pos = (-1.0, 0.0, cylinder_height, cylinder_radius)# 生成点云points1 = generate_cylinder(cylinder1_pos[0], cylinder1_pos[1],cylinder_radius, cylinder_height)points2 = generate_cylinder(cylinder2_pos[0], cylinder2_pos[1],cylinder_radius, cylinder_height)all_points = np.vstack((points1, points2))# 创建圆柱Markermarker_array = MarkerArray()marker_array.markers.append(create_cylinder_marker(cylinder1_pos[0], cylinder1_pos[1], cylinder_height, cylinder_radius, 0))marker_array.markers.append(create_cylinder_marker(cylinder2_pos[0], cylinder2_pos[1], cylinder_height, cylinder_radius, 1))# 小球运动参数ball_radius = 0.2ball_z = ball_radius  # 小球离地高度t = 0.0rate = rospy.Rate(10)  # 10Hz# 存储小球历史位置ball_history = []max_history = 200  # 存储的历史点数rospy.loginfo("Starting simulation: two cylinders with ball moving in figure-8 pattern")while not rospy.is_shutdown():# 更新小球位置 (8字形轨迹)# 参数方程: x = sin(t), y = sin(t)cos(t)ball_x = np.sin(t)ball_y = 0.5 * np.sin(t) * np.cos(t) * 2  # 调整y轴幅度# 记录小球位置ball_history.append((ball_x, ball_y))if len(ball_history) > max_history:ball_history.pop(0)# 创建小球Markerball_marker = create_ball_marker(ball_x, ball_y, ball_z, 0)# 更新MarkerArraycurrent_markers = MarkerArray()current_markers.markers = marker_array.markers[:]  # 复制圆柱Markercurrent_markers.markers.append(ball_marker)# 创建并发布顶视图图像camera_image = create_top_view_image(cylinder1_pos,cylinder2_pos,(ball_x, ball_y, ball_z),ball_history)image_msg = bridge.cv2_to_imgmsg(camera_image, "bgr8")image_msg.header.stamp = rospy.Time.now()image_pub.publish(image_msg)# 发布点云和标记pcl_pub.publish(all_points)marker_pub.publish(current_markers)# 更新时间t += 0.1if t > 2 * math.pi:t = 0rate.sleep()if __name__ == '__main__':try:main()except rospy.ROSInterruptException:pass
EOF
代码关键功能解析:
- 点云生成:使用
generate_cylinder()函数创建圆柱点云- 可视化标记:
create_cylinder_marker()和create_ball_marker()定义RVIZ中的3D物体- 顶视图渲染:
create_top_view_image()使用OpenCV绘制2D场景- 运动轨迹:小球按参数方程
x = sin(t), y = sin(t)cos(t)形成8字形轨迹
6. 配置RVIZ默认视图
RVIZ是ROS的可视化工具,预配置可简化启动过程:
cat > /opt/ros/noetic/share/rviz/default.rviz <<-'EOF'
Toolbars:toolButtonStyle: 2
Visualization Manager:Class: ""Displays:- Alpha: 0.5Cell Size: 1Class: rviz/GridColor: 160; 160; 164Enabled: trueLine Style:Line Width: 0.029999999329447746Value: LinesName: GridNormal Cell Count: 0Offset:X: 0Y: 0Z: 0Plane: XYPlane Cell Count: 10Reference Frame: <Fixed Frame>Value: true- Alpha: 1Autocompute Intensity Bounds: trueAutocompute Value Bounds:Max Value: 10Min Value: -10Value: trueAxis: ZChannel Name: intensityClass: rviz/PointCloud2Color: 252; 175; 62Color Transformer: FlatColorDecay Time: 0Enabled: trueInvert Rainbow: falseMax Color: 255; 255; 255Min Color: 0; 0; 0Name: PointCloud2Position Transformer: XYZQueue Size: 10Selectable: trueSize (Pixels): 3Size (m): 0.03999999910593033Style: Flat SquaresTopic: /v2x_pclUnreliable: falseUse Fixed Frame: trueUse rainbow: trueValue: true- Class: rviz/ImageEnabled: trueImage Topic: /v2x_top_viewMax Value: 1Median window: 5Min Value: 0Name: ImageNormalize Range: trueQueue Size: 2Transport Hint: rawUnreliable: falseValue: true- Class: rviz/MarkerArrayEnabled: trueMarker Topic: /v2x_markersName: MarkerArrayNamespaces:ball: truecylinders: trueQueue Size: 100Value: trueEnabled: trueGlobal Options:Background Color: 48; 48; 48Default Light: trueFixed Frame: mapFrame Rate: 30Name: root
EOF
此配置文件预设了:
- 点云显示(订阅/v2x_pcl话题)
- 图像显示(订阅/v2x_top_view话题)
- 标记显示(订阅/v2x_markers话题)
- 网格参考系
7. 创建启动脚本
自动化启动所有组件:
cat > run.sh <<-'EOF'
killall -9 python3
killall -9 roscore
# 启动ROS核心
roscore &# 启动节点
python3 v2x_node_top_view.py &# 启动可视化工具
rosrun rviz rviz
EOF
8. 运行可视化系统
启动完整系统:
source ~/.bashrc
bash run.sh
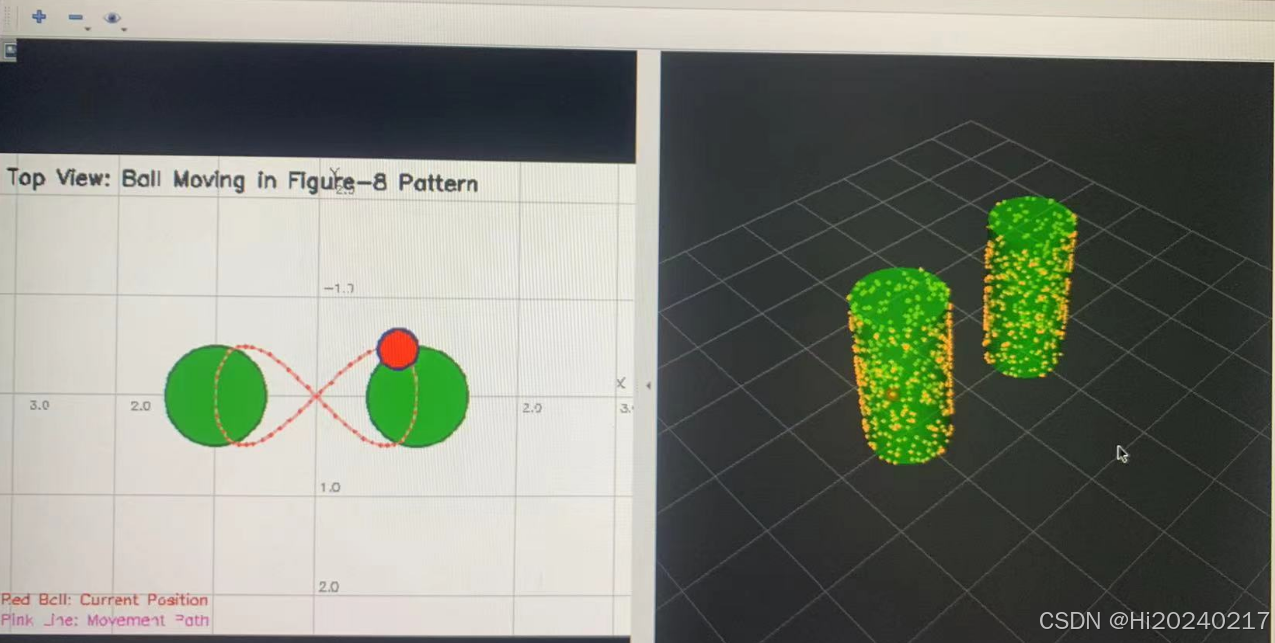
效果展示与交互
成功运行后,您将看到:
- RVIZ主窗口:显示点云构成的圆柱和运动的小球
- 图像窗口:显示场景的顶视图,包含轨迹历史
- 终端输出:显示节点运行状态
技术解析
ROS节点通信架构
本系统采用典型的ROS发布/订阅模型:
[节点]                   [话题]                [可视化工具]
v2x_node_top_view.py -> /v2x_pcl (PointCloud2) -> RVIZ点云显示-> /v2x_markers (MarkerArray) -> RVIZ标记显示-> /v2x_top_view (Image) -> RVIZ图像显示
运动模型原理
小球运动基于参数方程:
x = sin(t)
y = 0.5 * sin(t) * cos(t) * 2
当t从0到2π变化时,小球轨迹形成经典的8字形(利萨如图形的一种)。
性能优化技巧
在RK3588等嵌入式设备上优化ROS性能:
- 降低点云密度:减少
generate_cylinder()的num_points参数 - 调整刷新率:修改
rospy.Rate(10)中的频率值 - 简化可视化:在RVIZ中关闭不需要的显示插件
- 历史轨迹优化:调整
max_history值减少存储
应用场景扩展
此技术方案可应用于:
- 机器人仿真测试:模拟传感器数据
- 算法验证平台:测试SLAM、路径规划算法
- 教育演示系统:直观展示机器人技术原理
- 工业监控:设备运行状态可视化
总结
本文详细介绍了在RK3588上搭建ROS1环境并创建可视化节点的全过程。通过Docker容器化方案,我们实现了:
- 轻量级ROS环境部署
- 复杂物理场景模拟
- 多模态数据融合可视化
- 嵌入式平台优化技巧
这种方案不仅适用于RK3588平台,也可扩展到其他嵌入式设备。结合ROS强大的生态系统,开发者可以快速构建和测试各类机器人应用。