Python-homework
1.if_name_=='main'的含义,why?
假设有一个文件 module.py,内容如下:
def greet():print("Hello from module!")if __name__ == '__main__':print("This is the main script.")greet()
-
如果直接执行
module.py:python module.py输出会是:
This is the main script.
Hello from module!
这里的
if __name__ == '__main__'条件成立,程序执行了print("This is the main script.")和greet()。 -
如果作为模块导入到其他脚本中:
假设有另一个脚本
test.py,内容如下:import module module.greet()当执行
test.py时,module.py中的if __name__ == '__main__'这一部分的代码不会被执行。输出会是:Hello from module!print("This is the main script.")不会被打印,因为它仅在module.py被直接执行时才会执行。
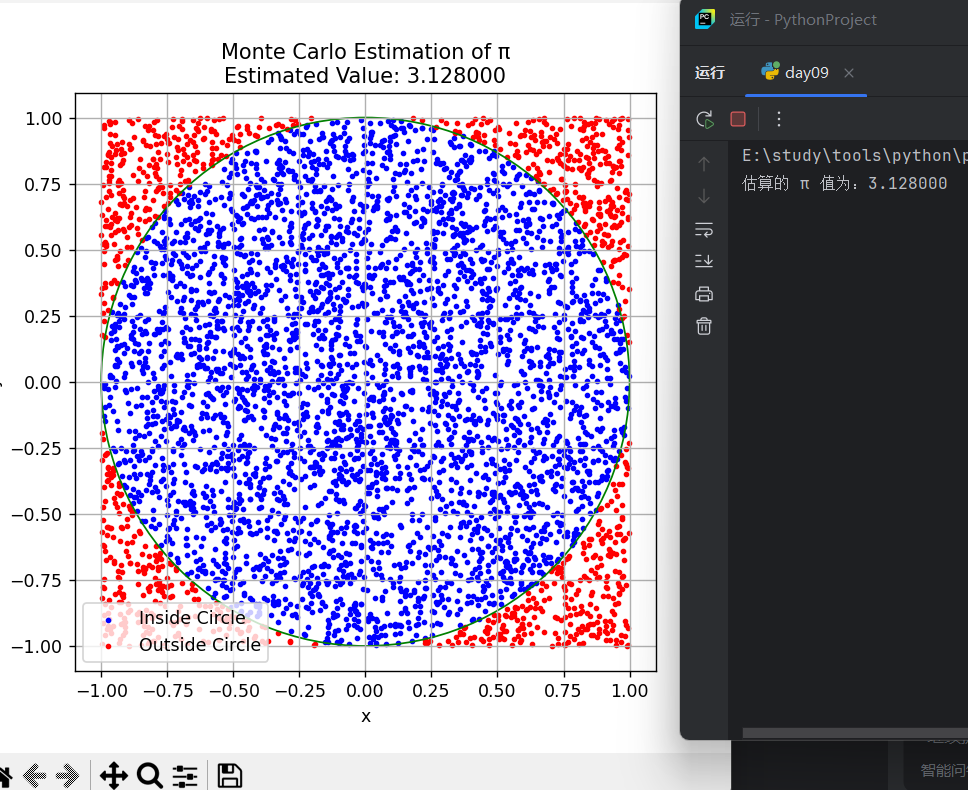
2 .蒙特卡罗方法手搓图形
法1,代码如下:
import random
import math
import matplotlib.pyplot as plt# 设置随机点数量
num_points = 5000# 初始化计数器
inside_circle = 0# 存储点坐标用于绘图
x_inside, y_inside = [], []
x_outside, y_outside = [], []# 蒙特卡罗模拟
for _ in range(num_points):x = random.uniform(-1, 1)y = random.uniform(-1, 1)distance = x**2 + y**2if distance <= 1:inside_circle += 1x_inside.append(x)y_inside.append(y)else:x_outside.append(x)y_outside.append(y)# 估算 π 值
pi_estimate = 4 * inside_circle / num_points
print(f"估算的 π 值为:{pi_estimate:.6f}")# 绘图部分
plt.figure(figsize=(6, 6))
plt.scatter(x_inside, y_inside, color='blue', s=5, label='Inside Circle')
plt.scatter(x_outside, y_outside, color='red', s=5, label='Outside Circle')# 画出单位圆边界
circle = plt.Circle((0, 0), 1, color='green', fill=False)
plt.gca().add_patch(circle)# 图像设置
plt.title(f"Monte Carlo Estimation of π\nEstimated Value: {pi_estimate:.6f}")
plt.xlabel("x")
plt.ylabel("y")
plt.legend()
plt.axis("equal")
plt.grid(True)
plt.show()
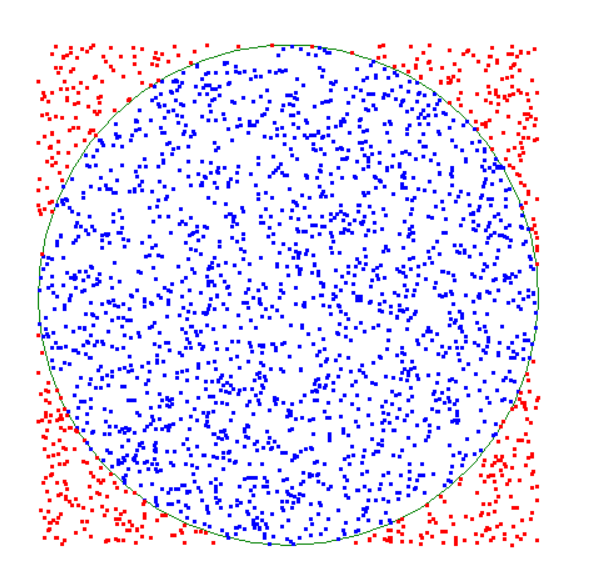
法2,代码如下:
import random
import turtle# 设置模拟参数
num_points = 5000
scale = 200  # 放大比例,把 [-1,1] 映射到屏幕坐标# 初始化 turtle
screen = turtle.Screen()
screen.setup(width=600, height=600)
screen.title("Monte Carlo Estimation of π with Turtle")
pen = turtle.Turtle()
pen.speed(0)
pen.hideturtle()# 绘制单位圆(半径为 scale)
pen.penup()
pen.goto(0, -scale)
pen.pendown()
pen.color("green")
pen.circle(scale)# 存储点用于统计
inside_circle = 0# 蒙特卡罗模拟 + 绘图
for _ in range(num_points):x = random.uniform(-1, 1)y = random.uniform(-1, 1)distance = x ** 2 + y ** 2# 将坐标放大到屏幕上screen_x = x * scalescreen_y = y * scalepen.penup()pen.goto(screen_x, screen_y)pen.pendown()if distance <= 1:pen.color("blue")  # 圆内点inside_circle += 1else:pen.color("red")   # 圆外点pen.dot(4)  # 画一个小点# 估算 π 值
pi_estimate = 4 * inside_circle / num_points
print(f"估算的 π 值为:{pi_estimate:.6f}")# 结束绘图
turtle.done()
3.字符田字格绘制。编写程序,用字符方式打印输出一个简单的田字格,输出效果如图5.16所示。要求采用函数方式,以田字格宽度为参数,能够根据参数绘制任意大小的田字格。
代码如下:
def draw(n):line = 3 * n + 1for i in range(1, line + 1):if i % 3 == 1:print(n * "+----+", end="")print("+")else:print("| " * n, end="")print("|")def main():n = eval(input("请输入您想要的阶数:"))draw(n)main() 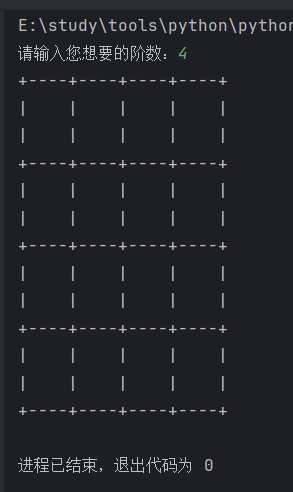
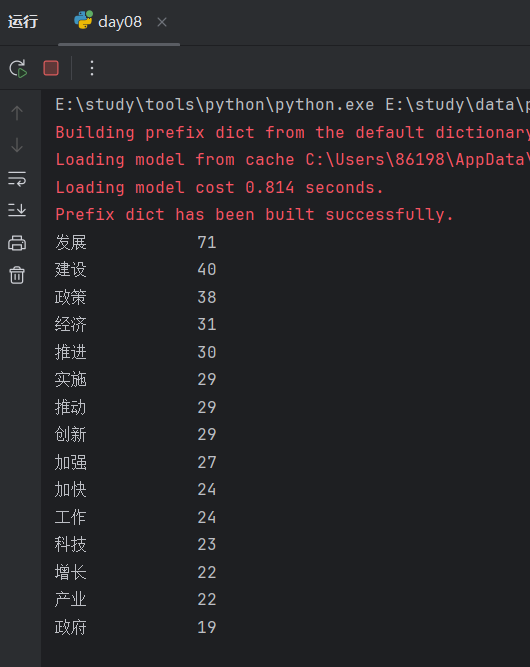
4.编写程序,统计两会政府工作报告热词频率,并生成词云
代码如下:
import jieba
import wordcloudfname = "E:/study/data/pythondata/政府工作报告.txt"
stopwords = ["的", "了", "在", "是", "我", "有", "和", "就", "不", "人", "都", "一", "一个", "上", "也", "很", "到", "说", "要","会", "去", "你", "会", "着", "看", "好", "自己", "这", "不是", "知道", "就是", "没有", "现在", "而是", "虽然", "一样", "两人", "说话", "有些", "两个"]with open(fname, "r", encoding="utf-8") as f :ls = jieba.lcut(f.read())counts = {}
for item in reversed(ls) :if len(item) == 1 :ls.remove(item)elif item in stopwords :ls.remove(item)else :counts[item] = counts.get(item, 0) + 1lls = list(counts.items())
lls.sort(key=lambda x:x[1], reverse=True)
for i in range(15) :word,cnt=lls[i]print("{0:<10}{1:>5}".format(word,cnt))w = wordcloud.WordCloud(width=1000, height=800, background_color="white",font_path="msyh.ttc")txt = " ".join(ls)
w.generate(txt)
w.to_file("E:/study/data/pythondata/wordcloud03.png")

希望能帮助到您,谢谢!