一种新颖的可解释人工智能框架,用于整合统计、视觉和基于规则的方法进行医学图像分类|文献速递-医学影像算法文献分享
Title
题目
A novel explainable AI framework for medical image classification integrating statistical, visual, and rule-based methods
一种新颖的可解释人工智能框架,用于整合统计、视觉和基于规则的方法进行医学图像分类
01
文献速递介绍
近年来,人工智能(AI)和深度学习(DL)彻底改变了对预测准确性要求较高的领域,尤其在医疗健康、刑事司法等高风险应用中表现突出(Aamir等人,2021)。在医疗健康领域,深度学习模型显著提高了多种成像模态下的诊断准确性,包括磁共振成像(MRI)、胸部X光片、组织病理学和超声检查(Qayyum等人,2024;Ullah等人,2023)。尽管这些模型取得了成功,但它们因缺乏透明度和可解释性而受到批评,这在医疗健康等关键领域引发了信任和伦理方面的担忧(Rudin,2019;Poon和Sung,2021)。 为应对这些挑战,可解释人工智能(XAI)和可解释性人工智能(IAI)应运而生(Ullah等人,2024a)。XAI技术对深度学习模型的决策逻辑进行解释,在不牺牲准确性的前提下提高透明度和信任度。事后XAI方法,如特征重要性排序(Wojtas和Chen,2020)、显著图(Gomez等人,2022)和基于梯度的可视化(Selvaraju等人,2017),旨在揭示黑箱模型的内部机制。相比之下,IAI开发具有内在透明度的模型,如决策树或基于规则的系统,以人类可理解的形式呈现决策过程(Reyes等人,2020;De Falco等人,2023)。 然而,一些关键局限性仍然存在。尽管从卷积层提取的深度特征在分类任务中有效,但这些特征较为抽象,缺乏专家可理解的语义互操作性,使得人们难以理解特定特征如何影响决策。此外,大多数可视化方法(如显著图)仅突出与预测相关的一般输入区域,无法提供详细的特征级解释。基于规则的方法往往缺乏与视觉解释的整合,导致见解碎片化。这种脱节在医疗健康领域尤其成问题,因为透明且精确的解释对于信任和决策至关重要。 为解决这些问题,本研究提出了统计、视觉和基于规则的可解释框架(SVIS-RULEX)。这个新框架整合了统计、视觉和基于规则的解释,以说明基于深度学习的模型在处理医学图像时如何做出决策。与传统方法不同,该框架将深度特征转化为可解释的统计属性,实现可追踪和可量化的预测。此外,还引入了一种名为SFMOV的新方法。SFMOV通过将统计量(如均值、偏度、熵)叠加到特征图上来增强可视化效果,提供局部化和特定于特征的见解。通过融合统计、视觉和基于规则的解释,这种方法确保了更高的透明度和可解释性,这对医疗健康应用至关重要。 为验证其稳健性和通用性,SVIS-RULEX框架在来自Kaggle的五个不同医学影像数据集上进行了评估,涵盖胸部X光片、乳腺超声、脑部MRI、组织病理学和眼底图像。这种广泛的评估证明了该框架在各种成像模态和疾病条件下的适应性和有效性。 本研究的主要贡献总结如下: 1. 一种双路径方法,整合视觉和基于规则的解释,以增强可解释性同时保持分类性能。 2. 使用定制的MobileNetv2模型提取深度特征,捕捉来自不同医学成像模态的高维表示。 3. 引入一种新颖的统计特征工程方法,从深度特征中生成26个人类可理解的属性(如均值、方差、偏度、熵),以提高可解释性。 4. 开发新颖的ZFMIS策略用于特征排序和选择,确保特征集紧凑且信息丰富。 5. 使用决策树(DT)和RuleFit进行基于规则的解释,为模型的决策过程提供人类可理解的见解。 6. 提出新颖的SFMOV技术,可视化卷积特征的统计叠加(均值、偏度、熵),并通过密集层属性加权,以实现更深层次的可解释性。 7. 与放射科医生一起对SFMOV可视化进行临床验证,确认其诊断相关性和实际意义。 论文的其余部分结构如下:第2节回顾相关工作。第3节详细介绍所提出的方法。第4节展示并讨论结果,第5节总结全文。
Abatract
摘要
Artificial intelligence and deep learning are powerful tools for extracting knowledge from large datasets,particularly in healthcare. However, their black-box nature raises interpretability concerns, especially in highstakes applications. Existing eXplainable Artificial Intelligence methods often focus solely on visualization orrule-based explanations, limiting interpretability’s depth and clarity. This work proposes a novel explainableAI method specifically designed for medical image analysis, integrating statistical, visual, and rule-basedexplanations to improve transparency in deep learning models. Statistical features are derived from deepfeatures extracted using a custom Mobilenetv2 model. A two-step feature selection method – zero-basedfiltering with mutual importance selection – ranks and refines these features. Decision tree and RuleFit modelsare employed to classify data and extract human-readable rules. Additionally, a novel statistical feature mapoverlay visualization generates heatmap-like representations of three key statistical measures (mean, skewness,and entropy), providing both localized and quantifiable visual explanations of model decisions. The proposedmethod has been validated on five medical imaging datasets – COVID-19 radiography, ultrasound breast cancer,brain tumor magnetic resonance imaging, lung and colon cancer histopathological, and glaucoma images – withresults confirmed by medical experts, demonstrating its effectiveness in enhancing interpretability for medicalimage classification tasks.
人工智能和深度学习是从大型数据集中提取知识的强大工具,尤其在医疗健康领域。然而,它们的“黑箱”特性引发了可解释性方面的担忧,在高风险应用中更是如此。现有的可解释人工智能(XAI)方法往往仅聚焦于可视化或基于规则的解释,这限制了可解释性的深度和清晰度。 本研究提出了一种专为医学图像分析设计的新型可解释人工智能方法,通过整合统计、视觉和基于规则的解释,提高深度学习模型的透明度。统计特征源自使用定制化MobileNetV2模型提取的深度特征。研究采用两步特征选择法——基于零值的过滤结合互重要性选择——对这些特征进行排序和优化。决策树和RuleFit模型被用于数据分类并提取人类可理解的规则。此外,一种新颖的统计特征图叠加可视化方法生成了三种关键统计量(均值、偏度和熵)的类热图表示,为模型决策提供了兼具定位性和可量化的视觉解释。 该方法已在五个医学影像数据集上进行了验证,包括COVID-19放射影像、乳腺超声肿瘤、脑肿瘤磁共振成像、肺和结肠癌症病理组织切片以及青光眼图像。医学专家对结果的确认表明,该方法在增强医学图像分类任务的可解释性方面具有显著成效。
Method
方法
This work integrates rule-based modeling and visualizations withstatistical feature engineering and DL-based feature extraction to produce human-understandable explanations. This method bridges thegap between interpretable techniques’ transparency and black-box DLmodels’ predictive power. Fig. 1 shows an overview of the proposedmethod. First, some existing techniques are used in preprocessing, likedata augmentations, image resizing, and region of interest cropping.The resultant dataset is then fed into the custom MobileNetv2 DL modelfor feature extraction to capture complex visual patterns and get morediscriminative and informative deep features, which are crucial foraccurate classification. These extracted features are then used for statistical transformation to compute interpretable, summary-level insights.Next, a novel ZFMIS technique ranks and filters features based on theirinterpretive value. The filtered and selected features are then used totrain the decision tree and RuleFit interpretable rule-based models. Finally, Grad-CAM-inspired heatmaps (SFMOV) are generated to visualizethe most important statistical features and highlight spatial regions ofthe images that contribute significantly to the model’s decision-makingprocess. Visual overlays enhance statistical interpretation by illustrating how specific patterns affect categorization judgments, providingstakeholders with an intuitive understanding of the prediction model’sbehavior, a model-agnostic visual explanation technique.The pseudocode of the proposed methodology is presented in Algorithm 1. Each step is discussed in detail in the subsequent sections
本研究将基于规则的建模、可视化技术与统计特征工程及基于深度学习(DL)的特征提取相结合,生成人类可理解的解释。该方法填补了可解释技术的透明度与黑箱深度学习模型的预测能力之间的差距。图1展示了所提方法的整体框架:首先,采用一些现有技术进行预处理,如数据增强、图像 resize 和感兴趣区域裁剪;然后,将处理后的数据集输入定制的 MobileNetv2 深度学习模型进行特征提取,以捕捉复杂的视觉模式,获得更具判别性和信息量的深度特征——这些特征对准确分类至关重要;接着,利用这些提取的特征进行统计转换,计算可解释的、汇总级别的洞察;之后,一种新颖的 ZFMIS 技术根据特征的解释价值对其进行排序和筛选;再将经过筛选和选择的特征用于训练决策树和 RuleFit 这两种可解释的基于规则的模型;最后,生成受 Grad-CAM 启发的热图(SFMOV),以可视化最重要的统计特征,并突出对模型决策过程有显著影响的图像空间区域。视觉叠加通过说明特定模式如何影响分类判断,增强了统计解释的效果,为相关人员提供了对预测模型行为的直观理解,这是一种与模型无关的视觉解释技术。 所提方法的伪代码如算法1所示。后续章节将详细讨论每个步骤。
Conclusion
结论
This study proposed SVIS-RULEX as an innovative framework toenhance the interpretability of deep learning models, particularly forcritical applications in healthcare. By combining statistical feature engineering, rule-based modeling, and visual overlays, the methodologyaddresses key limitations of existing XAI approaches, offering a holisticsolution for interpreting black-box models in medical diagnostics.The framework demonstrated the ability to provide transparent,interpretable insights without compromising predictive performance.By integrating statistical metricssuch as mean, skewness, and entropy,the method enriched the interpretive capacity of deep learning models,while ZFMIS effectively reduced dimensionality, preserving only themost critical features. This approach facilitated the development ofinterpretable and high-performing models, offering valuable insightsinto the underlying patterns and decision-making processes of themodel.
本研究提出了SVIS-RULEX这一创新框架,旨在增强深度学习模型的可解释性,尤其适用于医疗健康领域的关键应用。该方法通过融合统计特征工程、基于规则的建模以及可视化叠加技术,解决了现有可解释人工智能(XAI)方法的主要局限性,为医疗诊断中“黑箱”模型的解释提供了一种全面的解决方案。 该框架在不影响预测性能的前提下,展现出提供透明、可解释见解的能力。通过整合均值、偏度和熵等统计指标,该方法增强了深度学习模型的解释能力;同时,ZFMIS(两阶段特征选择算法)有效实现了降维,仅保留最关键的特征。这种方法有助于开发出兼具可解释性和高性能的模型,为深入理解模型的潜在模式和决策过程提供了宝贵的见解。
Results
结果
This section introduces information about the experiments performed and the results produced in this study. This section also prvides additional information about the datasets, experimental setup,optimized hyper-parameters, and evaluation metrics used in this study.
本节介绍本研究中开展的实验及其产生的结果,还提供了关于本研究中使用的数据集、实验设置、优化的超参数和评估指标的额外信息。
Figure
图
Fig. 1. Workflow of the proposed approach.
图1. 所提方法的工作流程。
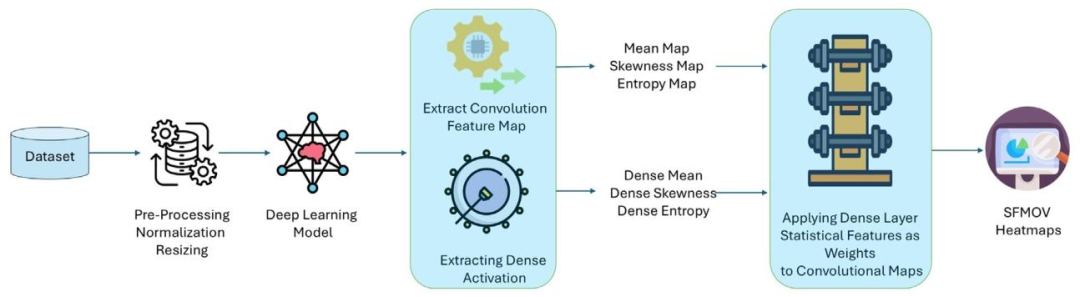
Fig. 2. SFMOV process, extracting Mean, Skewness, and Entropy maps from convolutional features and dense layer activations, normalizing and combining them into a weightedheatmap overlaid on the input image.
图2. SFMOV流程:从卷积特征和密集层激活中提取均值图、偏度图和熵图,对其进行归一化处理后组合成加权热图,并叠加到输入图像上。
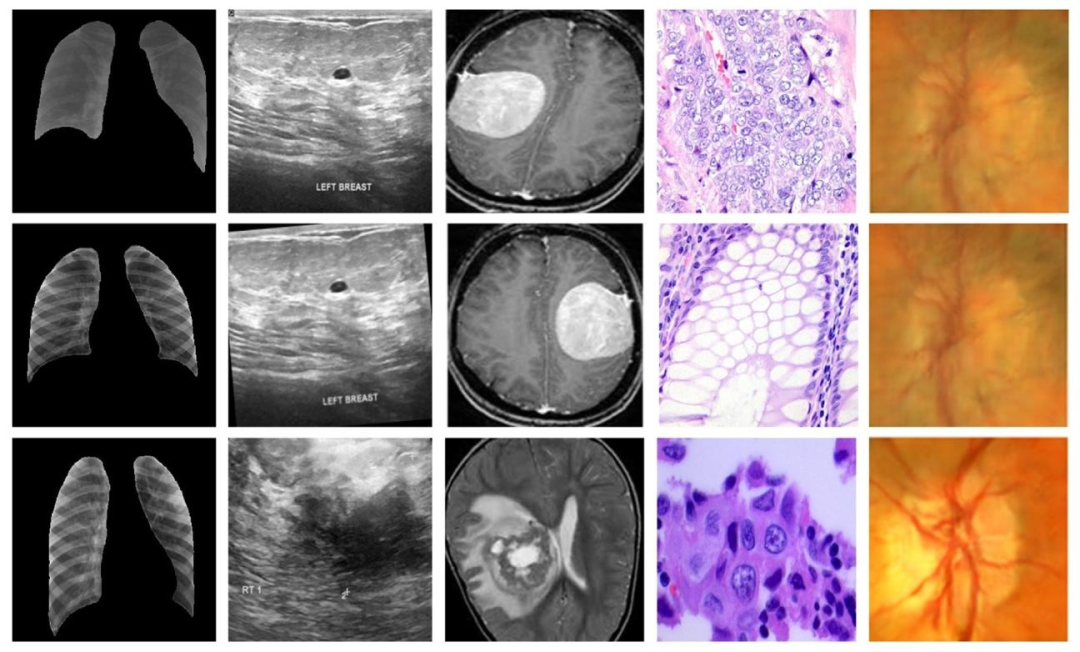
Fig. 3. Representative samples from all datasets, first, second, third, fourth, and fifth columns have representative samples from dataset 1, dataset 2, dataset 3, dataset 4, anddataset 5, respectively
图3. 所有数据集的代表性样本,第一列、第二列、第三列、第四列和第五列分别为数据集1、数据集2、数据集3、数据集4和数据集5的代表性样本。
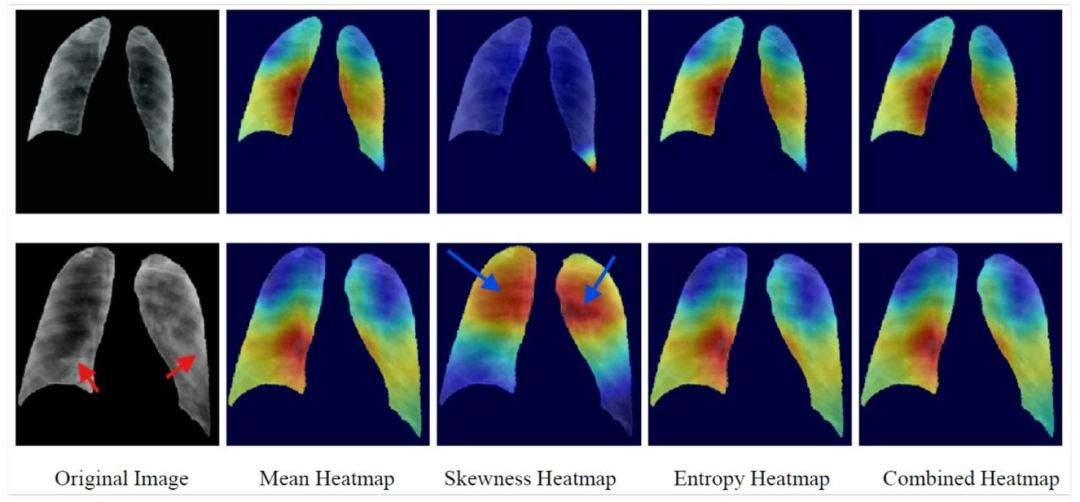
Fig. 4. SFMOV-based heatmap visualization showing a COVID-19 image detected as COVID-19 (row 1) and a COVID-19 image detection as viral pneumonia (row 2). Red arrowsindicate consolidation and blue arrows indicate healthy parenchyma (the latter is what is focused on).
图4. 基于SFMOV的热图可视化,展示了被检测为COVID-19的COVID-19图像(第1行)和被检测为病毒性肺炎的COVID-19图像(第2行)。红色箭头指示实变区域,蓝色箭头指示健康的实质组织(后者是关注的焦点)。
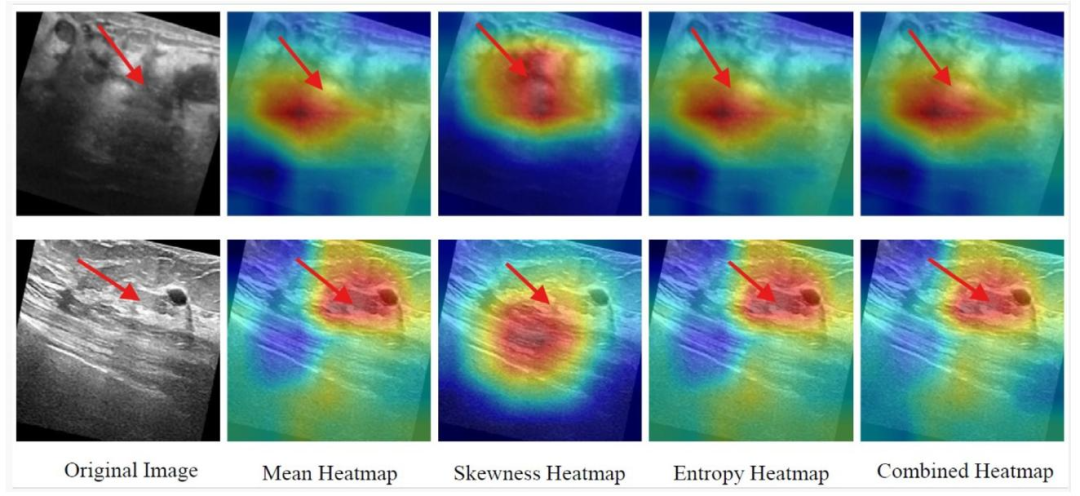
Fig. 5. SFMOV-based heatmap visualization showing a malignant ultrasound image detected as malignant (row 1) and a benign ultrasound image detection as benign (row 2).Red arrows represent the abrupt interface between healthy tissue and tumor.
图5. 基于SFMOV的热图可视化,展示了被检测为恶性的恶性超声图像(第1行)和被检测为良性的良性超声图像(第2行)。红色箭头表示健康组织与肿瘤之间的突变界面。
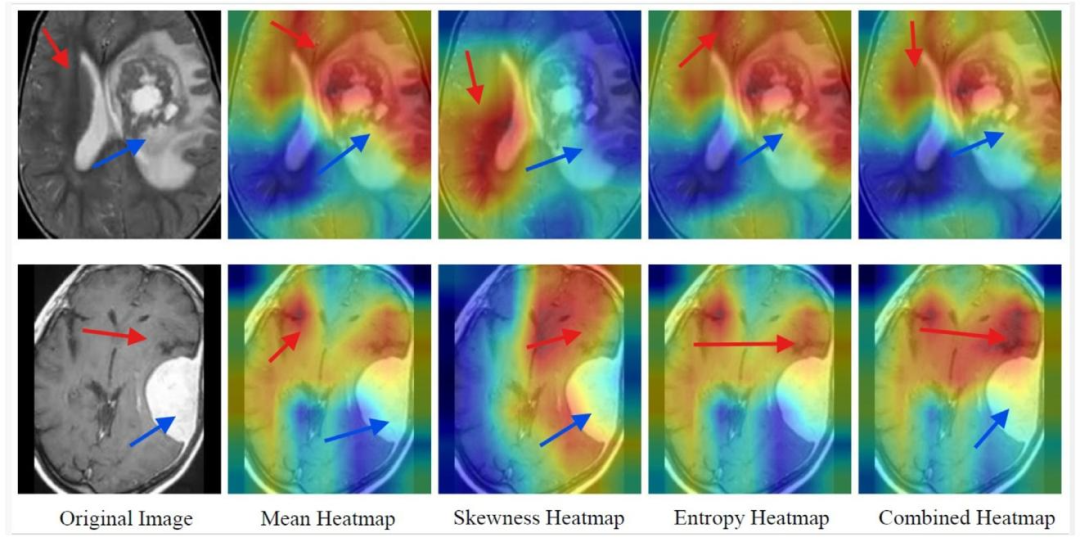
Fig. 6. SFMOV-based heatmap visualization showing a malignant image predicted as malignant (row 1) and a malignant image predicted as benign (row 2). Red arrows indicatethe healthy tissue/healthy interface, while blue arrows indicate the tumor/lesion.
图6. 基于SFMOV的热图可视化,展示了被预测为恶性的恶性图像(第1行)和被预测为良性的恶性图像(第2行)。红色箭头指示健康组织/健康界面,蓝色箭头指示肿瘤/病变区域。
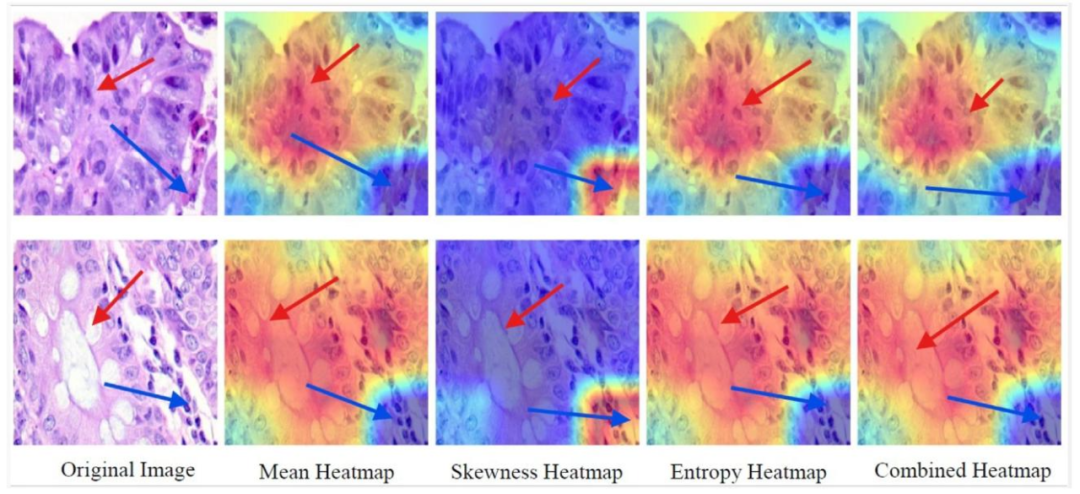
Fig. 7. SFMOV-based heatmap visualization showing a colon adenocarcinoma image predicted as colon adenocarcinoma (row 1) and a benign colon image predicted as benigncolon (row 2). The pathological area is indicated by the blue arrow, whereas the red arrow indicates the healthy tissue/the transition zone
图7. 基于SFMOV的热图可视化,展示了被预测为结肠腺癌的结肠腺癌图像(第1行)和被预测为良性结肠的良性结肠图像(第2行)。蓝色箭头指示病变区域,红色箭头指示健康组织/过渡区。
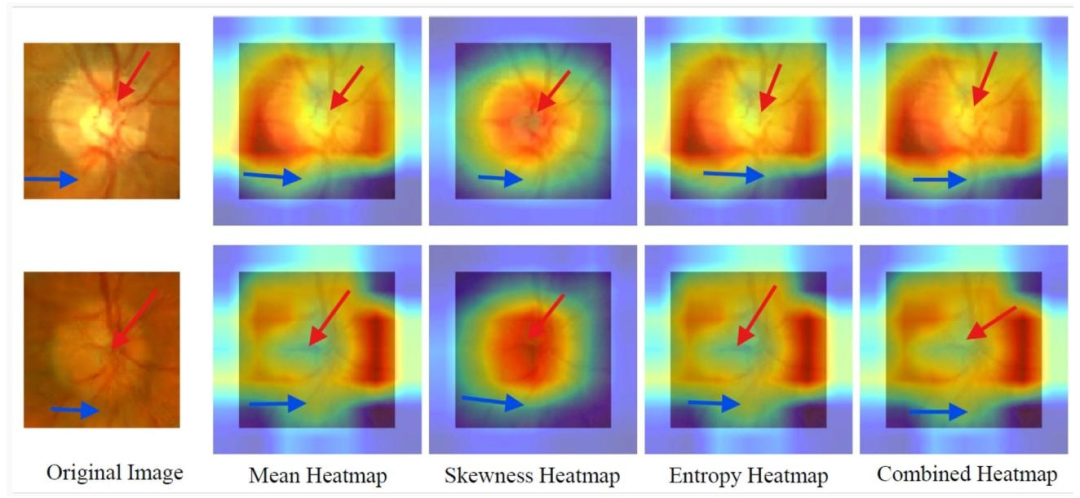
Fig. 8. SFMOV-based heatmap visualization showing a glaucoma image (row 1) and a normal image (row 2), both correctly classified, with model focus on clinically relevantoptic nerve regions. Red arrows indicate the macular zone, while blue ones are the transition zone with the non-macular area.
图8. 基于SFMOV的热图可视化,展示了一张青光眼图像(第1行)和一张正常图像(第2行),两者均被正确分类,模型聚焦于临床相关的视神经区域。红色箭头指示黄斑区,蓝色箭头指示与非黄斑区的过渡区。
Table
表
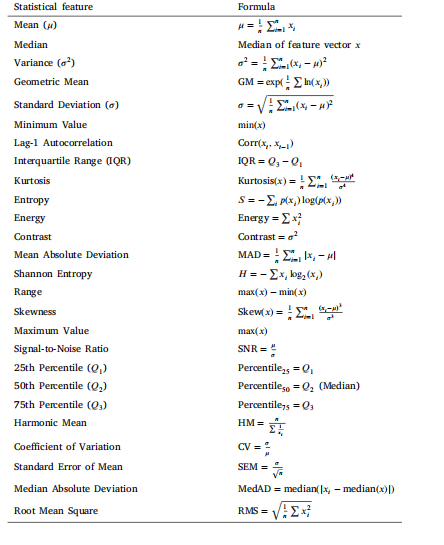
Table 1Statistical feature descriptions and formulas.
表1 统计特征描述及公式。
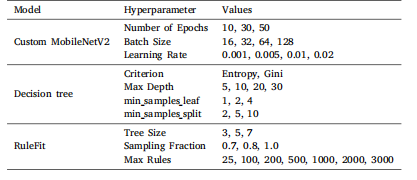
Table 2Hyperparameters values for each model used in grid search optimization
表2 网格搜索优化中所用各模型的超参数值。
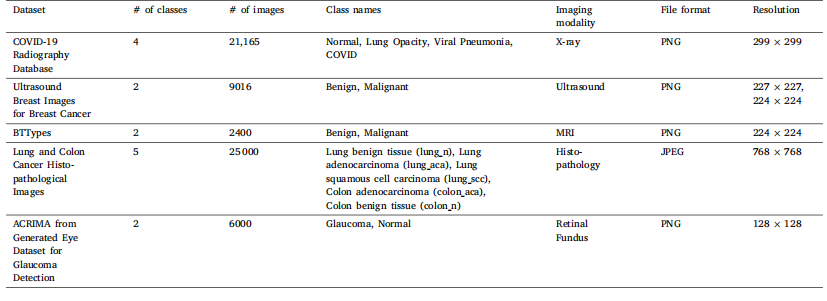
Table 3Summary of the datasets used in this study
表3 本研究中使用的数据集摘要。
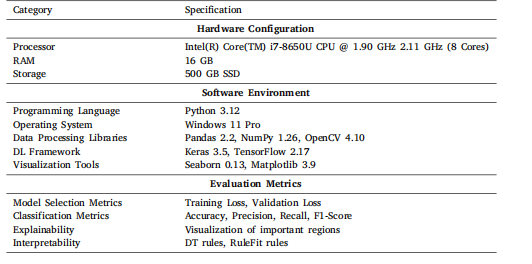
Table 4Experimental setup: Software and hardware specifications
表4 实验设置:软件和硬件规格。
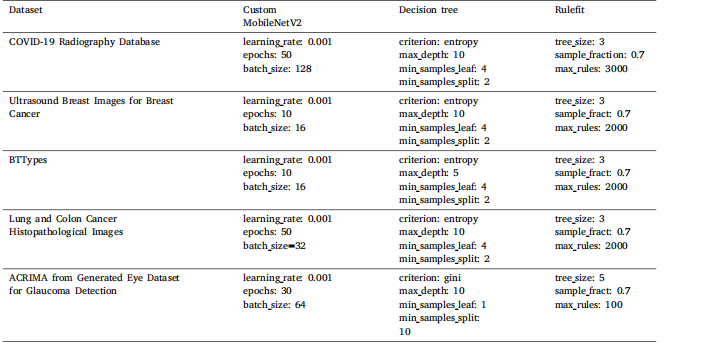
Table 5Summary of the optimized hyperparameters on each dataset.
表5 每个数据集上优化后的超参数摘要。
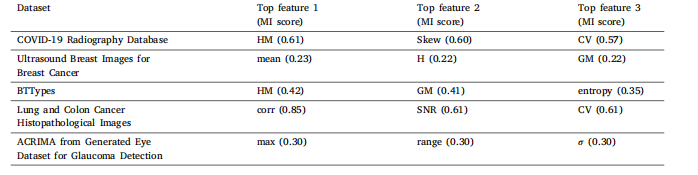
Table 6Top three selected features from 26 features set for each dataset based on MI after employing two-stage feature selection algorithm (ZFMIS).
表6 采用两阶段特征选择算法(ZFMIS)后,基于互信息(MI)从26个特征集中为每个数据集选出的前三名特征。
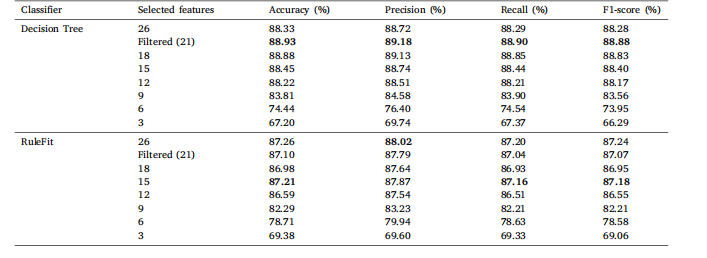
Table 7Classification results of COVID-19 Radiography Database on a comprehensive set of statistical features with varying feature counts for DT andRuleFit
表7 基于不同数量统计特征的COVID-19放射影像数据库分类结果(针对决策树(DT)和RuleFit模型)。
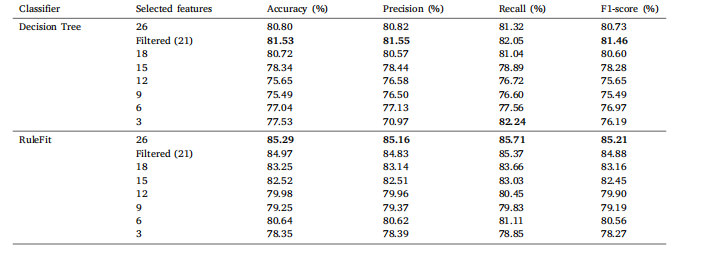
Table 8Classification results of Ultrasound Breast Images for Breast Cancer on a comprehensive set of statistical features with varying feature countsfor DT and RuleFit
表8 基于不同数量统计特征的乳腺癌超声图像分类结果(针对决策树(DT)和RuleFit模型)。
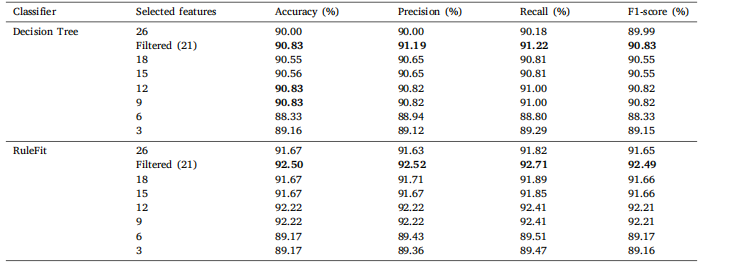
Table 9Classification results of Brain MRI Images for Brain Tumor Detection on comprehensive set of statistical features with varying feature countsfor DT and RuleFit.
表9 基于不同数量统计特征的脑肿瘤检测脑部MRI图像分类结果(针对决策树(DT)和RuleFit模型)。
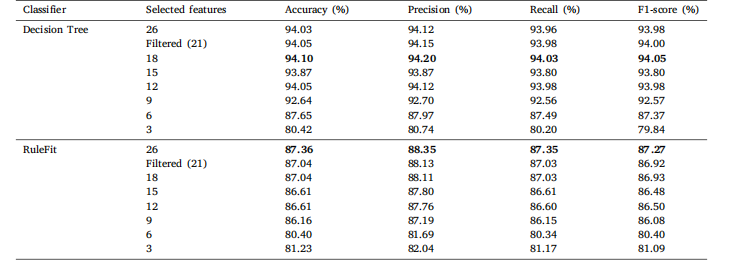
Table 10Classification results of Lung and Colon Cancer Histopathological Images on the comprehensive set of statistical features with varying featurecounts for DT and RuleFit.
表10 基于不同数量统计特征的肺和结肠癌病理组织图像分类结果(针对决策树(DT)和RuleFit模型)。
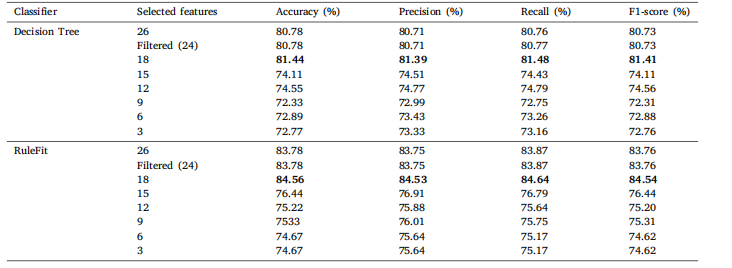
Table 11Classification results of ACRIMA from Generated Eye Dataset for Glaucoma Detection on the comprehensive set of statistical features withvarying feature counts for DT and RuleFit.
表11 基于不同数量统计特征的青光眼检测生成眼数据集(ACRIMA)分类结果(针对决策树(DT)和RuleFit模型)。

Table 12Decision tree rules for top two datasets based on classification performance.
表12 基于分类性能的前两个数据集的决策树规则。
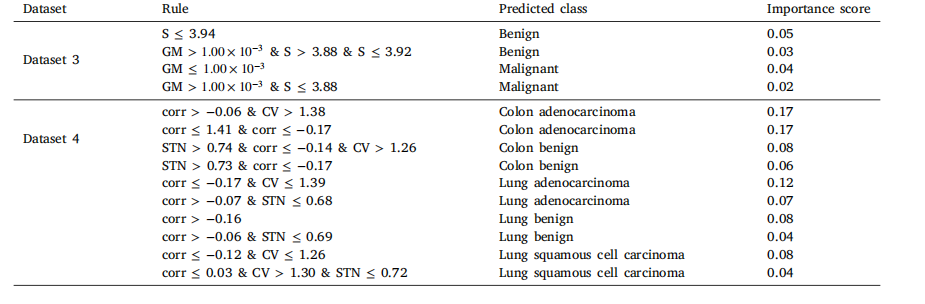
Table 13RuleFit rules for top two datasets based on classification performance.
表13 基于分类性能的前两个数据集的RuleFit规则。
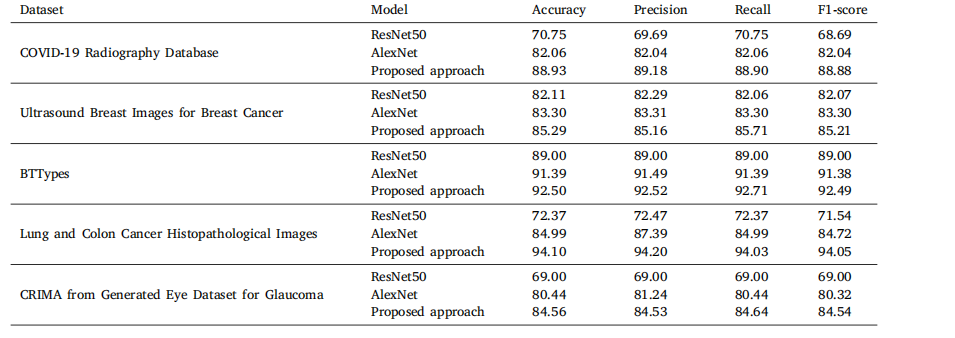
Table 14Classification performance of different noninterpretable approaches across multiple datasets
表14 不同非可解释性方法在多个数据集上的分类性能。
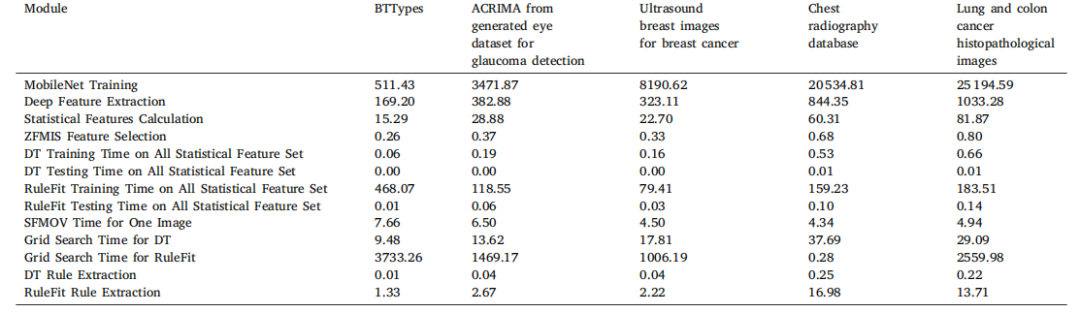
Table 15Computation time (in Seconds) for different modules on multiple datasets
表15 多个数据集上不同模块的计算时间(单位:秒)。