升级:用vue canvas画一个能源监测设备和设备的关系监测图!
用vue canvas画一个能源电表和设备的监测图-CSDN博客
上一篇文章,我是用后端的数据来画出监测图。这次我觉的,用前端来控制数据,更爽。
本期实现功能:
1,得到监测设备和设备的数据,然后进行存库
2,得到监测设备和设备的关系流程图,然后可以生成图片
3,后期对设备进行监测,可以得知设备的正常状态或者是异常状态。
先上图片:
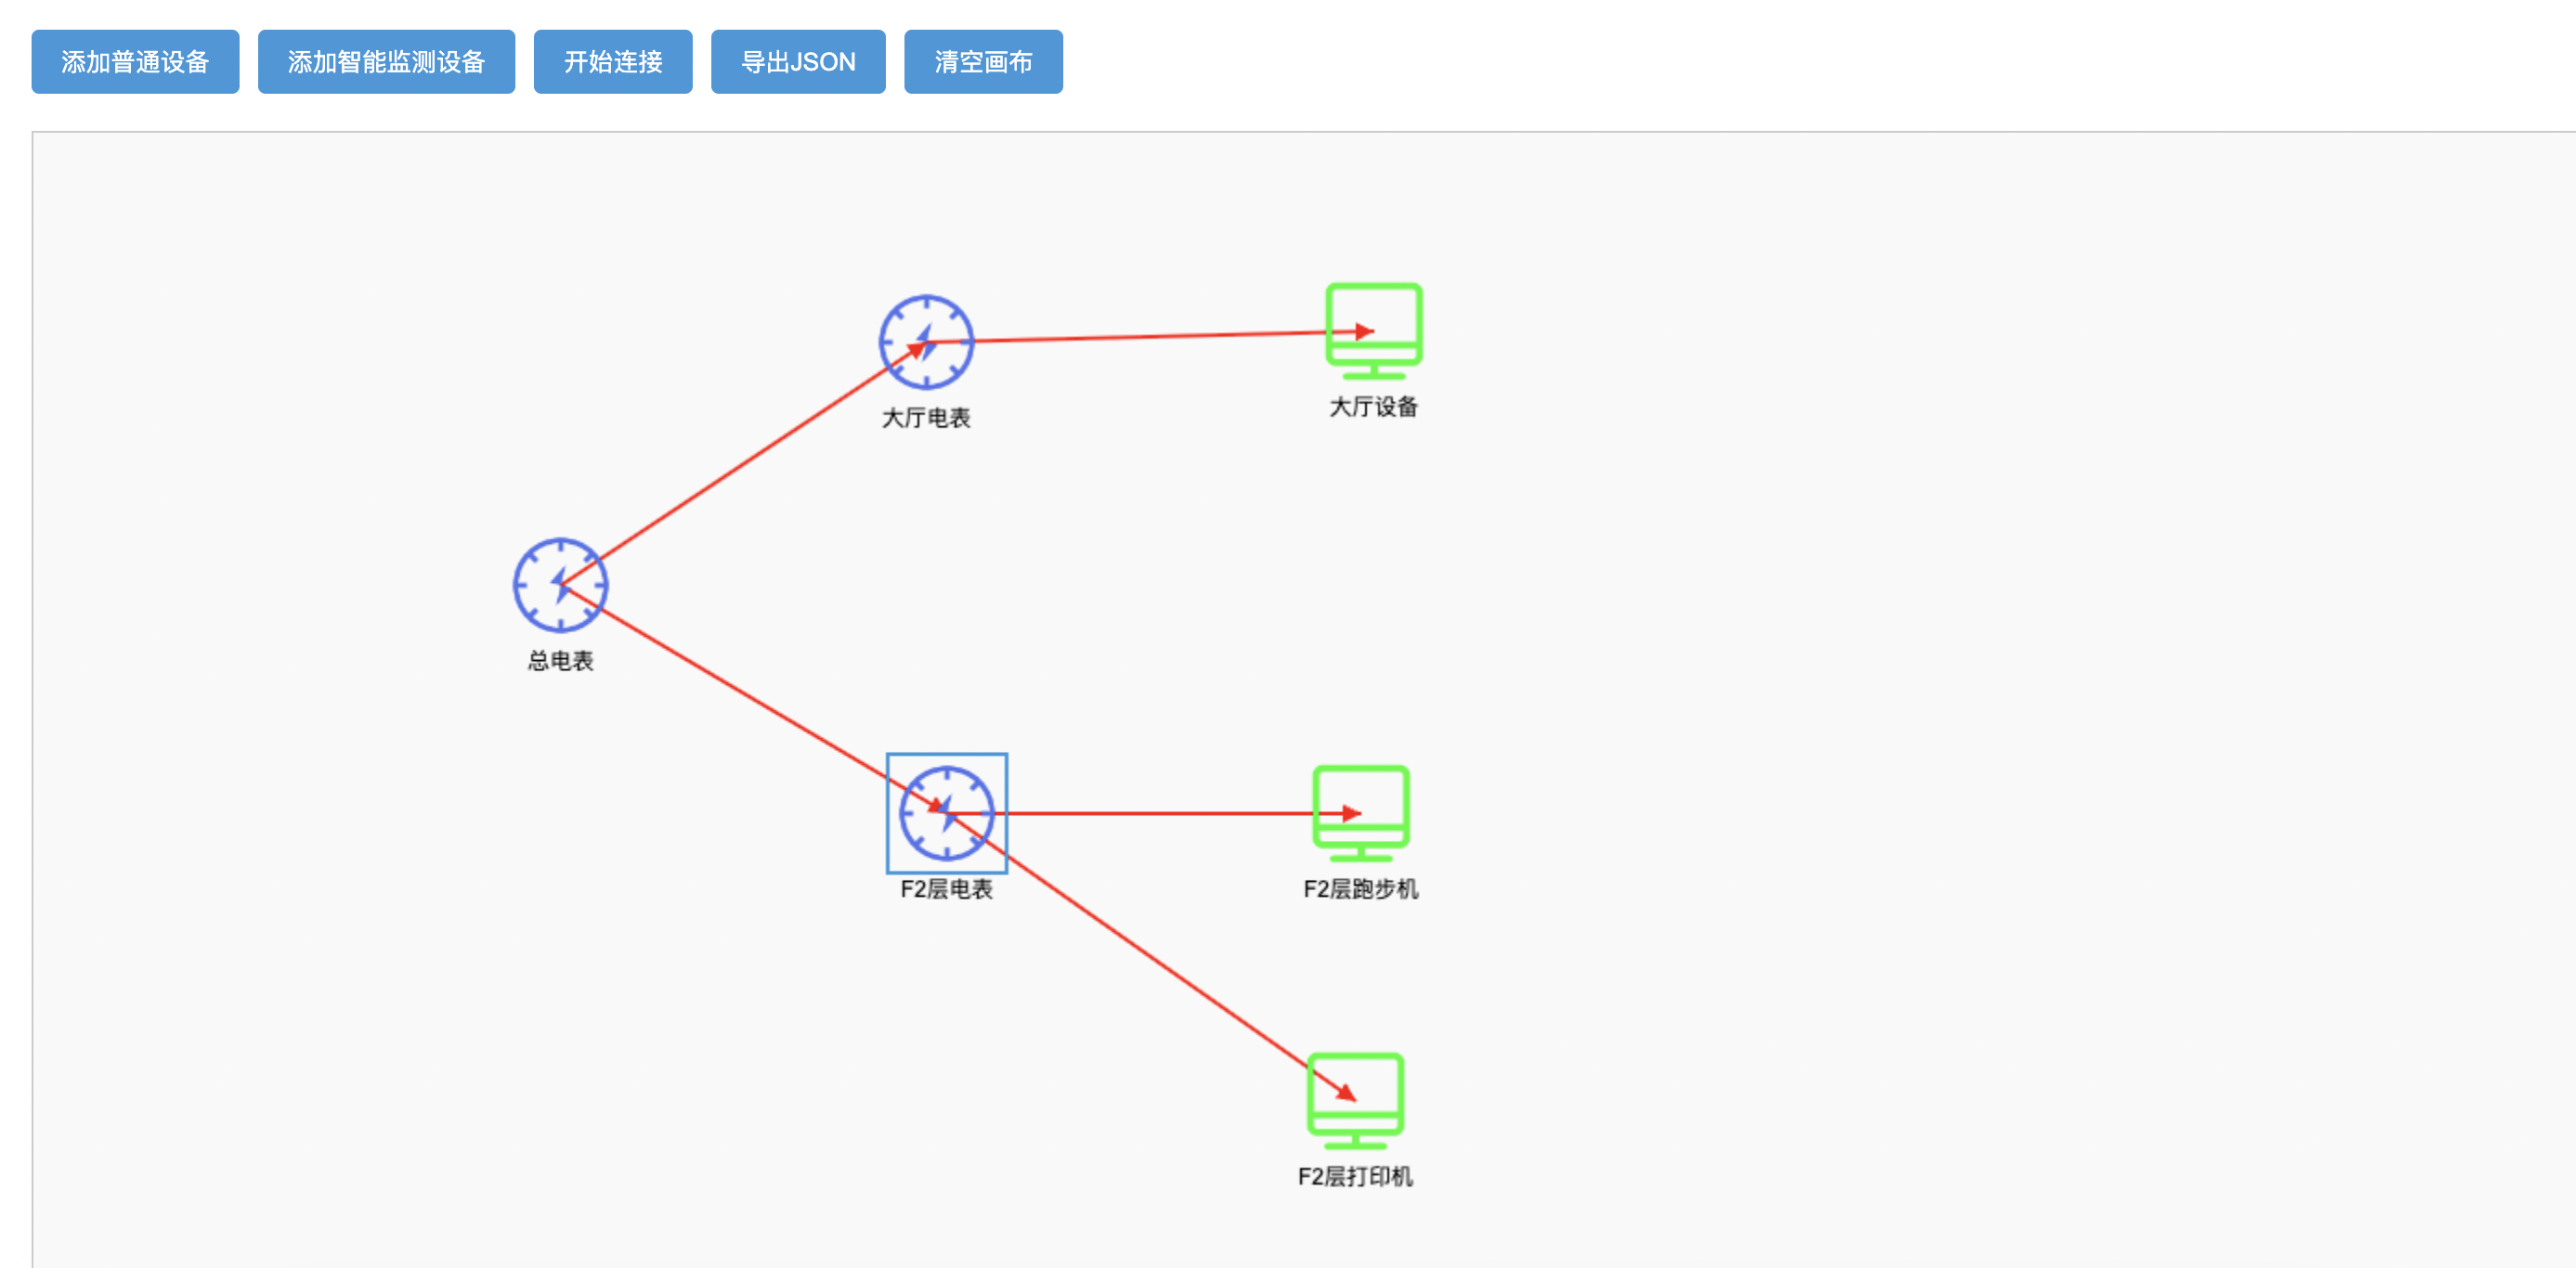
用法:
1.用户根据自己的监测设备和普通设备位置。在画布上绘出。
2.当用户绘制完后,导出数据则可获得所有的监测设备数据,设备数据,以及流程数据。
3.数据展示
{"devices": [{"id": "device-1748911468928","name": "F2层打印机","type": "normal","position": {"x": 682,"y": 492},"connections": [],"all": {"id": "device-1748911468928","type": "normal","name": "F2层打印机","position": {"x": 682,"y": 492},"size": {"width": 60,"height": 60},"connections": []}},{"id": "device-1748911470171","name": "F2层电表","type": "metering","position": {"x": 462,"y": 337},"connections": ["device-1748911476354","device-1748911468928"],"all": {"id": "device-1748911470171","type": "metering","name": "F2层电表","position": {"x": 462,"y": 337},"size": {"width": 60,"height": 60},"connections": ["device-1748911476354","device-1748911468928"]}},{"id": "device-1748911476354","name": "F2层跑步机","type": "normal","position": {"x": 685,"y": 337},"connections": [],"all": {"id": "device-1748911476354","type": "normal","name": "F2层跑步机","position": {"x": 685,"y": 337},"size": {"width": 60,"height": 60},"connections": []}},{"id": "device-1748911477587","name": "总电表","type": "metering","position": {"x": 254,"y": 214},"connections": ["device-1748911478408","device-1748911470171"],"all": {"id": "device-1748911477587","type": "metering","name": "总电表","position": {"x": 254,"y": 214},"size": {"width": 60,"height": 60},"connections": ["device-1748911478408","device-1748911470171"]}},{"id": "device-1748911478008","name": "大厅设备","type": "normal","position": {"x": 692,"y": 77},"connections": [],"all": {"id": "device-1748911478008","type": "normal","name": "大厅设备","position": {"x": 692,"y": 77},"size": {"width": 60,"height": 60},"connections": []}},{"id": "device-1748911478408","name": "大厅电表","type": "metering","position": {"x": 451,"y": 83},"connections": ["device-1748911478008"],"all": {"id": "device-1748911478408","type": "metering","name": "大厅电表","position": {"x": 451,"y": 83},"size": {"width": 60,"height": 60},"connections": ["device-1748911478008"]}}],"connections": [{"from": "device-1748911477587","to": "device-1748911478408","all": {"id": "conn-1748911650304","from": "device-1748911477587","to": "device-1748911478408","points": []}},{"from": "device-1748911477587","to": "device-1748911470171","all": {"id": "conn-1748911652725","from": "device-1748911477587","to": "device-1748911470171","points": []}},{"from": "device-1748911478408","to": "device-1748911478008","all": {"id": "conn-1748911655187","from": "device-1748911478408","to": "device-1748911478008","points": []}},{"from": "device-1748911470171","to": "device-1748911476354","all": {"id": "conn-1748911657504","from": "device-1748911470171","to": "device-1748911476354","points": []}},{"from": "device-1748911470171","to": "device-1748911468928","all": {"id": "conn-1748911660458","from": "device-1748911470171","to": "device-1748911468928","points": []}}]
}
4.根据数据,进行存库。type代表类型。connections则代表的每个设备之间的关系。
5.在来一张本地保存的图片:
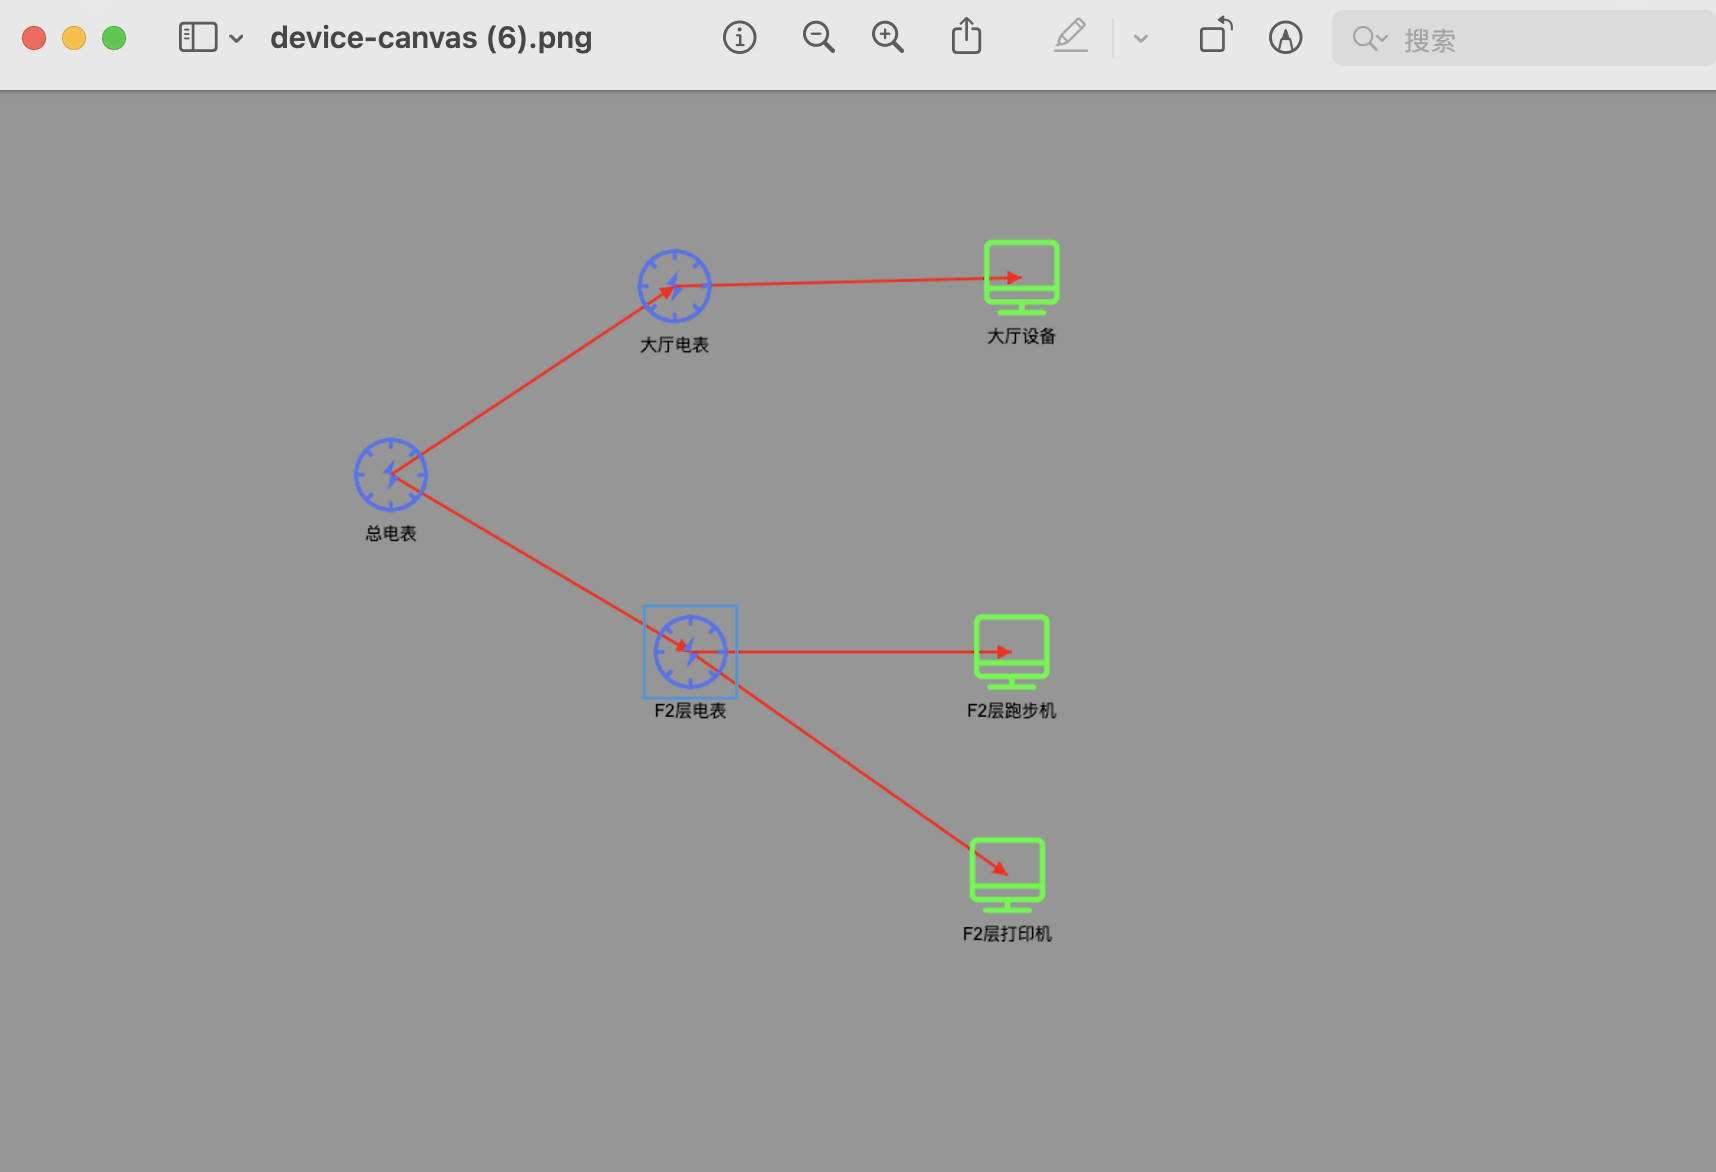
6.后期根据设备的状态,来动态的修改设备的图片。来展示出设备的异常状态和正常状态。
7.这样,设备管理部分就可以轻松搞定了。
欢迎各位大佬点评。
点点关注点点赞。
有需要代码的,留言或者私信。