pythonocc hlr实例 deepwiki 显示隐藏线

直接在pythonocc页面底下问,ai再也不会import自创类名了,带着文档编码的,降维打击了
import matplotlib.pyplot as plt
import matplotlib.patches as patches
from OCC.Core.BRepPrimAPI import BRepPrimAPI_MakeBox, BRepPrimAPI_MakeCylinder
from OCC.Core.BRepAlgoAPI import BRepAlgoAPI_Cut
from OCC.Core.gp import gp_Pnt, gp_Dir, gp_Ax2
from OCC.Extend.TopologyUtils import get_sorted_hlr_edges
from OCC.Core.BRepAdaptor import BRepAdaptor_Curve
from OCC.Core.GCPnts import GCPnts_UniformDeflection # 创建立方体
box = BRepPrimAPI_MakeBox(100, 100, 100).Shape() # 创建圆柱体作为盲孔
cylinder_ax = gp_Ax2(gp_Pnt(50, 50, 20), gp_Dir(0, 0, 1))
cylinder = BRepPrimAPI_MakeCylinder(cylinder_ax, 20, 60).Shape() # 布尔运算:从立方体中减去圆柱体
cut_op = BRepAlgoAPI_Cut(box, cylinder)
shape_with_hole = cut_op.Shape() def get_projection_edges(shape, direction): """获取指定方向的投影边""" visible_edges, hidden_edges = get_sorted_hlr_edges( shape, position=gp_Pnt(0, 0, 0), direction=direction, export_hidden_edges=True ) return visible_edges, hidden_edges def edge_to_2d_points(edge, deflection=0.1): """将3D边转换为2D点列表""" adaptor = BRepAdaptor_Curve(edge) discretizer = GCPnts_UniformDeflection(adaptor, deflection) points = [] for i in range(1, discretizer.NbPoints() + 1): pnt = discretizer.Value(i) points.append((pnt.X(), pnt.Y())) return points def plot_view(ax, visible_edges, hidden_edges, title): """绘制单个视图""" ax.set_title(title) ax.set_aspect('equal') # 绘制可见线(实线) for edge in visible_edges: points = edge_to_2d_points(edge) if len(points) > 1: x_coords = [p[0] for p in points] y_coords = [p[1] for p in points] ax.plot(x_coords, y_coords, 'b-', linewidth=1) # 绘制隐藏线(虚线) for edge in hidden_edges: points = edge_to_2d_points(edge) if len(points) > 1: x_coords = [p[0] for p in points] y_coords = [p[1] for p in points] ax.plot(x_coords, y_coords, 'r--', linewidth=0.5) # 创建三视图
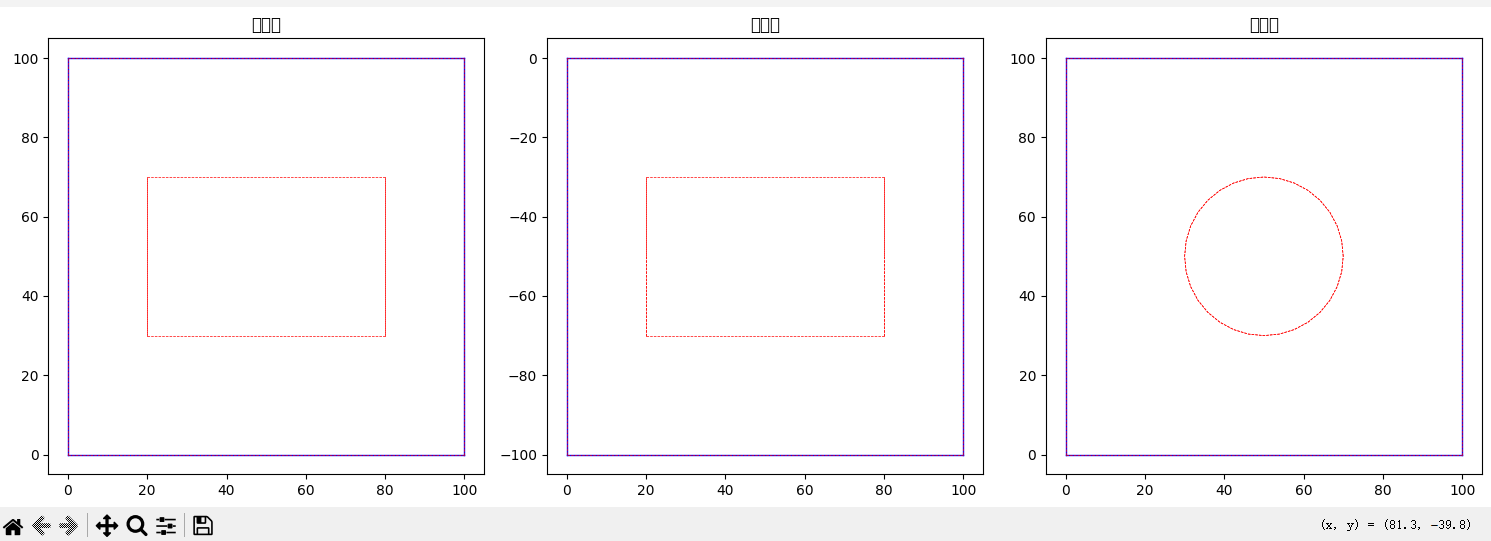
fig, (ax1, ax2, ax3) = plt.subplots(1, 3, figsize=(15, 5)) # 正视图 (前视图)
front_visible, front_hidden = get_projection_edges(shape_with_hole, gp_Dir(0, 1, 0))
plot_view(ax1, front_visible, front_hidden, "正视图") # 侧视图 (右视图)
side_visible, side_hidden = get_projection_edges(shape_with_hole, gp_Dir(1, 0, 0))
plot_view(ax2, side_visible, side_hidden, "侧视图") # 俯视图 (顶视图)
top_visible, top_hidden = get_projection_edges(shape_with_hole, gp_Dir(0, 0, 1))
plot_view(ax3, top_visible, top_hidden, "俯视图") plt.tight_layout()
plt.show()