前端面试宝典---项目难点1-leaflet大数据量渲染优化
引言
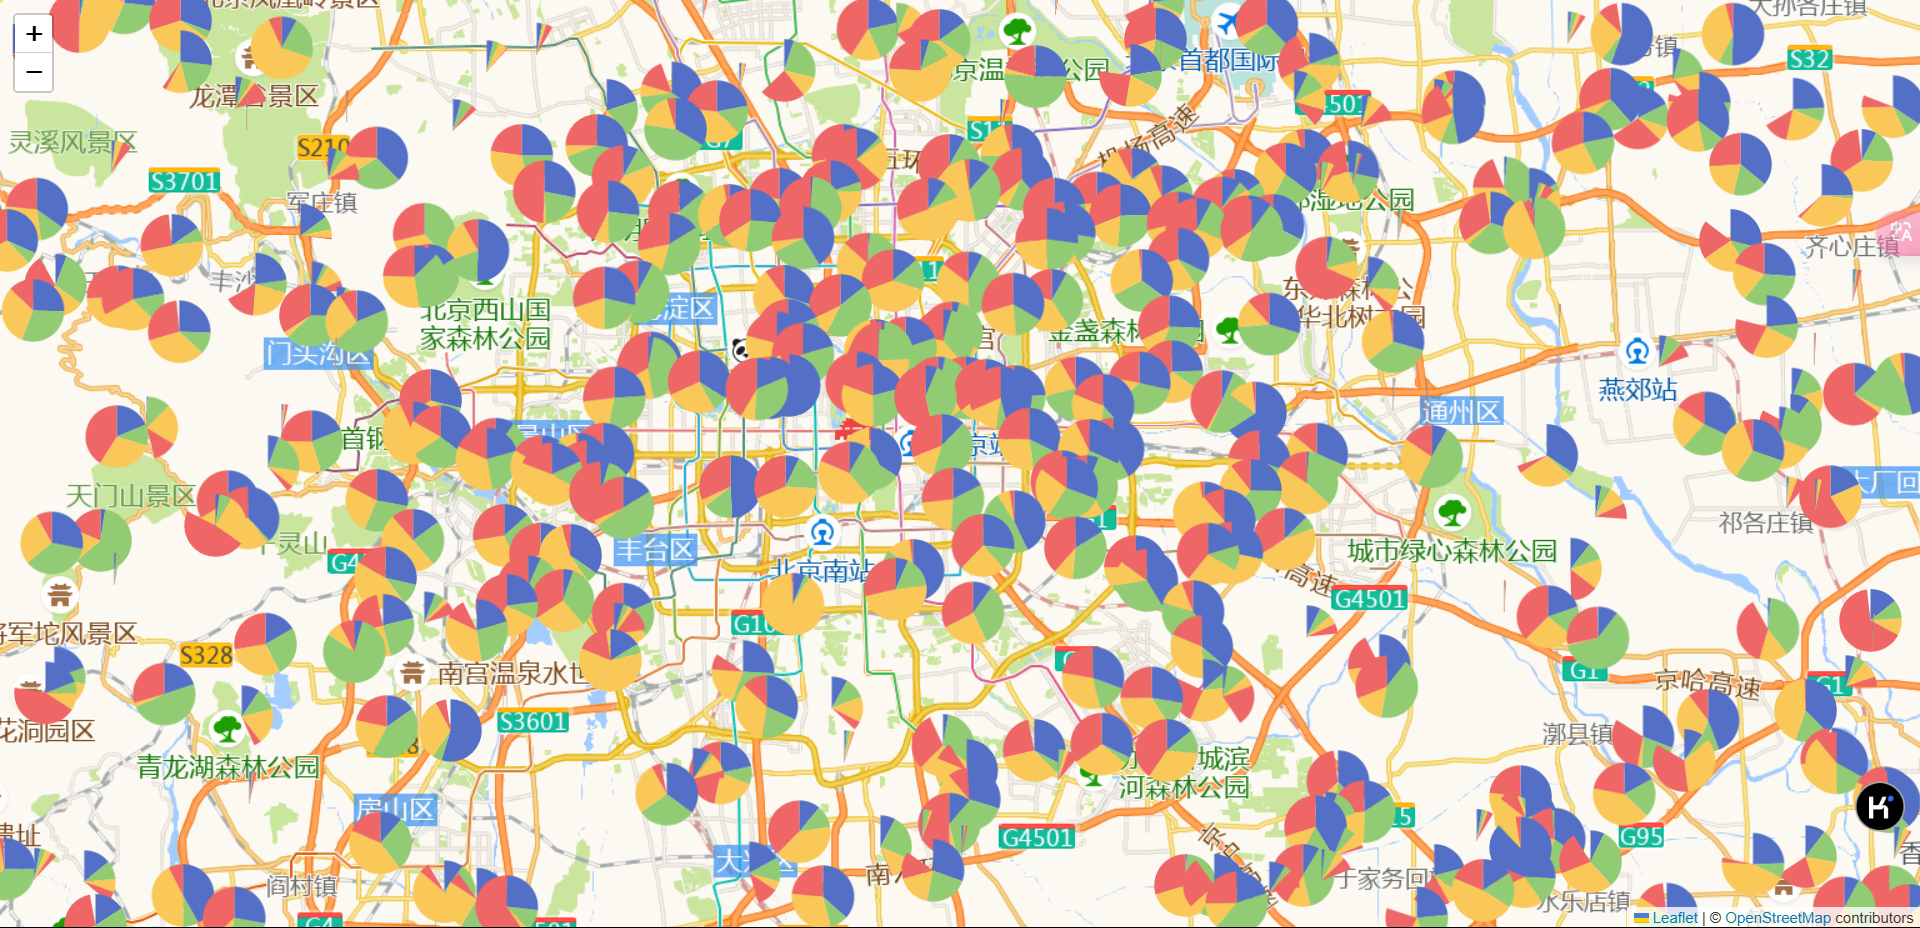
大数据量渲染性能优化,在地图上渲染2000个ECharts饼图,直接渲染会导致页面卡顿甚至崩溃
解决方案:
- 实现视口检测机制,只渲染当前可见区域内的数据点
- 使用分块渲染策略,每次只处理15ms的计算任务,避免阻塞主线程
- 采用防抖技术优化地图移动/缩放事件的触发频率
示例代码—不是伪代码可以直接复制到项目跑通
<template><div class="map-container" ref="mapContainer"></div>
</template><script>
import L from 'leaflet'
import 'leaflet/dist/leaflet.css'
import * as echarts from 'echarts'export default {name: 'MapComponent',data() {return {map: null,points: [], // 存储所有点数据renderedCharts: new Map(), // 已渲染的图表chartInstances: new Map(), // Echarts实例debounceTimer: null,pointsMap: new Map(),}},mounted() {this.initMap()this.generatePoints(2000) // 生成2000个点数据this.renderVisiblePoints()// 监听地图移动和缩放事件this.map.on('moveend zoomend', this.debounce(this.renderVisiblePoints, 300))},beforeDestroy() {// 清理资源if (this.map) {this.map.off('moveend zoomend', this.renderVisiblePoints)this.map.remove()}// 销毁所有Echarts实例this.chartInstances.forEach((chart) => {if (chart) chart.dispose()})this.renderedCharts.clear()this.chartInstances.clear()},methods: {initMap() {// 初始化Leaflet地图this.map = L.map(this.$refs.mapContainer).setView([39.90923, 116.397428],12)// 添加地图图层L.tileLayer('http://wprd04.is.autonavi.com/appmaptile?lang=zh_cn&size=1&style=7&x={x}&y={y}&z={z}',{attribution:'© <a href="https://www.openstreetmap.org/copyright">OpenStreetMap</a> contributors',}).addTo(this.map)},// 生成随机点数据generatePoints(count) {const points = []for (let i = 0; i < count; i++) {// 在北京区域内生成随机点const lat = 39.5 + Math.random() * 1.0const lng = 115.5 + Math.random() * 1.5points.push({id: i,lat,lng,data: [{ value: Math.random() * 100, name: '类别1' },{ value: Math.random() * 100, name: '类别2' },{ value: Math.random() * 100, name: '类别3' },{ value: Math.random() * 100, name: '类别4' },],})}this.points = pointsthis.pointsMap = new Map(this.points.map((point) => [point.id, point]))},// 判断点是否在可见区域内isPointInBounds(point) {const bounds = this.map.getBounds()return bounds.contains([point.lat, point.lng])},// 渲染可见区域内的点renderVisiblePoints(n = 0) {const bounds = this.map.getBounds()const zoom = this.map.getZoom()// 清除不在可见区域内的图表this.renderedCharts.forEach((marker, id) => {const point = this.pointsMap.get(id)if (!point || !this.isPointInBounds(point)) {marker.remove()this.renderedCharts.delete(id)// 销毁Echarts实例if (this.chartInstances.has(id)) {this.chartInstances.get(id).dispose()this.chartInstances.delete(id)}}})// 1. 优化后:渲染可见区域内的点,每次只计算15ms,之后就立马把剩余没做的方法settimeout的宏任务里let startTime = Date.now()for (; n < this.points.length; n++) {let endTime = Date.now()const point = this.points[n]if (this.isPointInBounds(point) && !this.renderedCharts.has(point.id)) {this.createChartMarker(point)}if (endTime - startTime > 15) {setTimeout(() => {this.renderVisiblePoints(n)}, 0)break}}// 2. 优化前:一次性渲染所有点// this.points.forEach((point) => {// if (this.isPointInBounds(point) && !this.renderedCharts.has(point.id)) {// this.createChartMarker(point)// }// })},// 创建带有Echarts饼图的地图标记createChartMarker(point) {// 创建一个div用于渲染Echartsconst chartDiv = document.createElement('div')chartDiv.style.width = '100px'chartDiv.style.height = '100px'chartDiv.id = `chart-${point.id}`// 创建自定义HTML标记const customMarker = L.divIcon({html: chartDiv.outerHTML,className: 'custom-chart-marker',iconSize: [100, 100],iconAnchor: [50, 50],})// 添加标记到地图const marker = L.marker([point.lat, point.lng], {icon: customMarker,}).addTo(this.map)this.renderedCharts.set(point.id, marker)// 确保div已添加到DOM后再初始化Echartsthis.$nextTick(() => {const chartDom = document.getElementById(`chart-${point.id}`)if (!chartDom) returnconst chart = echarts.init(chartDom)// 设置Echarts配置const option = {series: [{type: 'pie',radius: '50%',data: point.data,label: {show: false,},emphasis: {label: {show: true,formatter: '{b}: {c}',},},},],}chart.setOption(option)this.chartInstances.set(point.id, chart)// 监听地图缩放事件,调整图表大小this.map.on('zoomend', () => {if (!chart._disposed) {// console.log(chart)chart.resize()} else {this.chartInstances.delete(point.id)}})})},// 防抖函数debounce(func, delay) {return () => {clearTimeout(this.debounceTimer)this.debounceTimer = setTimeout(() => {func.apply(this)}, delay)}},},
}
</script><style scoped>
.map-container {width: 100vw;height: 100vh;
}.custom-chart-marker {background: none !important;border: none !important;
}
</style>