前端页面用html2canvas下载为图片
📊 如何使用 html2canvas 将 ECharts 图表导出为图片
本篇教程将演示如何在 Vue 项目中使用 ECharts + html2canvas 实现以下功能:
- 渲染多个 ECharts 图表
- 使用
html2canvas将页面指定区域截图导出为高清图片 - 支持导出 PNG 文件(也可以后续插入 Word 等)
✅ 效果预览
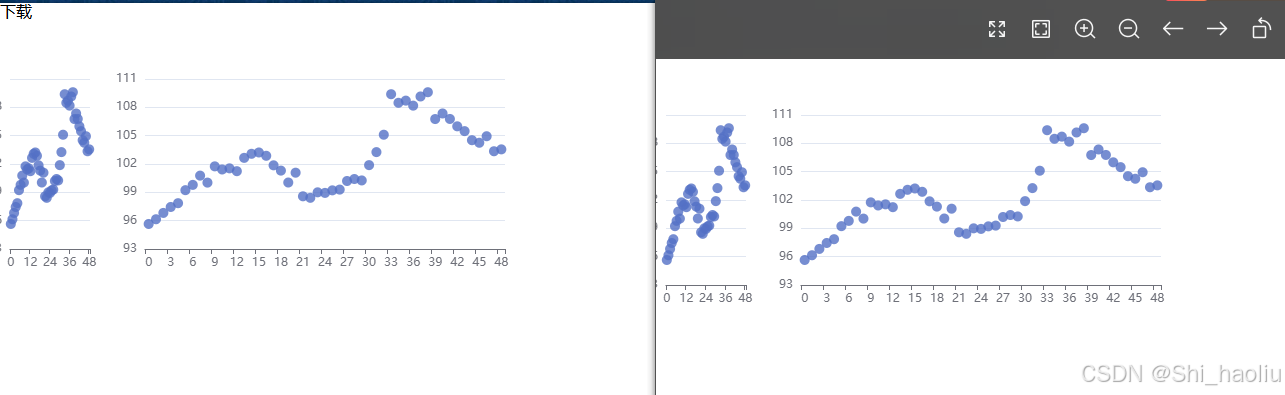
点击「下载」按钮后,将当前图表区域导出为一张高清图片。
🧱 技术栈
- Vue 2
- ECharts
- html2canvas(用于 DOM 转图片)
📦 安装依赖
使用 npm 安装 html2canvas:
npm install html2canvas
💡 页面结构说明
外层容器 #combatTable,控制截图区域,设置了固定宽高
内含两个 ECharts 图表容器 #bar 和 #bar2
下载按钮触发截图并导出 PNG
🧩 完整代码
<template>
	<div>
		<div @click="generateAndDownloadReport">下载</div>
		<div style="height: 800px; width: 1200px" id="combatTable">
			<div
				style="height: 300px; width: 100px; display: inline-block"
				id="bar"
			></div>
			<div
				style="height: 300px; width: 450px; display: inline-block"
				id="bar2"
			></div>
		</div>
	</div>
</template>
<script>
import html2canvas from 'html2canvas';
export default {
	name: '',
	components: {},
	mixins: [],
	props: {},
	data() {
		return {};
	},
	computed: {},
	watch: {},
	mounted() {
		this.getEcharts();
	},
	methods: {
		getEcharts() {
			const panCharts = this.$echarts.init(
				document.querySelector('#bar')
			);
			const panCharts2 = this.$echarts.init(
				document.querySelector('#bar2')
			);
			let chartData = [
				95.65, 96.15, 96.82, 97.45, 97.85, 99.23, 99.79, 100.77, 100.03,
				101.75, 101.42, 101.54, 101.24, 102.65, 103.08, 103.22, 102.87,
				101.86, 101.3, 100.04, 101.08, 98.58, 98.42, 99, 98.94, 99.21,
				99.29, 100.2, 100.41, 100.26, 101.88, 103.26, 105.1, 109.39,
				108.48, 108.71, 108.18, 109.15, 109.6, 106.76, 107.35, 106.77,
				105.99, 105.48, 104.52, 104.25, 104.94, 103.35, 103.55,
			];
			const xData = Array.from(
				{ length: chartData.length },
				(_, index) => index
			);
			let options = {
				tooltip: {
					trigger: 'axis',
					axisPointer: {
						type: 'cross',
					},
				},
				xAxis: {
					type: 'category',
					data: xData,
				},
				yAxis: {
					scale: true,
				},
				series: [
					{
						symbolSize: 10,
						data: xData.map((x, i) => [x, chartData[i]]),
						type: 'scatter',
					},
				],
			};
			// 渲染 echarts
			panCharts.setOption(options, true);
			panCharts2.setOption(options, true);
		},
		generateAndDownloadReport() {
			try {
				const targetElement = document.getElementById('combatTable');

				html2canvas(targetElement, {
					scale: 1, // 提高分辨率
					backgroundColor: '#ffffff', // 背景色(可自定义)
					useCORS: true, // 如果有加载图片或图标
				}).then((canvas) => {
					// 生成图片链接
					const link = document.createElement('a');
					link.download = 'combat-report.png';
					link.href = canvas.toDataURL('image/png', 0.0);

					// 下载图片
					document.body.appendChild(link);
					link.click();
					document.body.removeChild(link);
				});
			} catch (error) {
				console.error('生成报告失败:', error);
				alert('下载失败:' + error.message);
			}
		},
	},
};
</script>
<style lang="" scoped></style>
🎯 关键参数说明
scale 控制图片清晰度(倍数) 2 或 3
backgroundColor 图片背景色 #ffffff(避免透明)
useCORS 是否启用跨域支持 true(必要时)
canvas.toDataURL() 导出为 Base64 图片 ‘image/png’, 1.0 表示高清
如果图片太大,可以适当压缩或限制 div 尺寸
html2canvas 不能截取视频或 iframe 内容